RYDER SYSTEM INC. - Daily - Technical analysis published on 11/26/2019 (GMT)
- 289
- 0
Click here for a new analysis!
- Timeframe : Daily
- - Analysis generated on
- Status : LEVEL MAINTAINED

Summary of the analysis

Additional analysis
Quotes
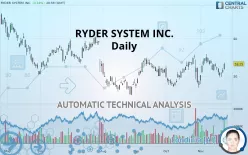
The RYDER SYSTEM INC. rating is 53.25 USD. On the day, this instrument gained +3.18% and was traded between 51.77 USD and 53.56 USD over the period. The price is currently at +2.86% from its lowest and -0.58% from its highest.A study of price movements over other periods shows the following variations:
Near a new HIGH record (1 month)
Type : Bullish
Timeframe : Weekly
Technical
Technical analysis of RYDER SYSTEM INC. in Daily shows an overall bullish trend. 71.43% of the signals given by moving averages are bullish. This bullish trend shows slight signs of slowing down given the slightly bullish signals given by the short-term moving averages. An assessment of moving averages reveals several bullish signals that could impact this trend:
Bullish trend reversal : adaptative moving average 50
Type : Bullish
Timeframe : Daily
Bullish price crossover with Moving Average 20
Type : Bullish
Timeframe : Daily
Bullish price crossover with adaptative moving average 50
Type : Bullish
Timeframe : Daily
Bullish price crossover with adaptative moving average 100
Type : Bullish
Timeframe : Daily
In fact, of the 18 technical indicators analysed by Central Analyzer, 8 are bullish, 4 are neutral and 6 are bearish. Caution: the Central Indicators scanner currently detects an excess:
Williams %R indicator is overbought : over -20
Type : Neutral
Timeframe : Daily
Pivot points : price is over resistance 1
Type : Neutral
Timeframe : Weekly
Pivot points : price is over resistance 2
Type : Neutral
Timeframe : Daily
Williams %R indicator is back over -50
Type : Bullish
Timeframe : Daily
Central Patterns, the scanner specializing in chart patterns, did not identify any signals.
The Central Candlesticks scanner, specialised in Japanese candlesticks, did not identify any signals.
| S3 | S2 | S1 | Price | R1 | R2 | R3 | |
|---|---|---|---|---|---|---|---|
| ProTrendLines | 45.12 | 47.87 | 50.50 | 53.25 | 54.72 | 58.95 | 64.55 |
| Change (%) | -15.27% | -10.10% | -5.16% | - | +2.76% | +10.70% | +21.22% |
| Change | -8.13 | -5.38 | -2.75 | - | +1.47 | +5.70 | +11.30 |
| Level | Minor | Major | Minor | - | Major | Major | Minor |
Pivot points can also be used to set your price objectives. Here is the price situation in relation to pivot points:
| Pivot points | S3 | S2 | S1 | PP | R1 | R2 | R3 |
|---|---|---|---|---|---|---|---|
| Standard | 49.56 | 50.20 | 50.90 | 51.54 | 52.24 | 52.88 | 53.58 |
| Camarilla | 51.24 | 51.36 | 51.49 | 51.61 | 51.73 | 51.86 | 51.98 |
| Woodie | 49.60 | 50.22 | 50.94 | 51.56 | 52.28 | 52.90 | 53.62 |
| Fibonacci | 50.20 | 50.71 | 51.03 | 51.54 | 52.05 | 52.37 | 52.88 |
| Pivot points | S3 | S2 | S1 | PP | R1 | R2 | R3 |
|---|---|---|---|---|---|---|---|
| Standard | 47.37 | 48.59 | 50.10 | 51.32 | 52.83 | 54.05 | 55.56 |
| Camarilla | 50.86 | 51.11 | 51.36 | 51.61 | 51.86 | 52.11 | 52.36 |
| Woodie | 47.52 | 48.66 | 50.25 | 51.39 | 52.98 | 54.12 | 55.71 |
| Fibonacci | 48.59 | 49.63 | 50.28 | 51.32 | 52.36 | 53.01 | 54.05 |
| Pivot points | S3 | S2 | S1 | PP | R1 | R2 | R3 |
|---|---|---|---|---|---|---|---|
| Standard | 35.93 | 41.16 | 44.64 | 49.87 | 53.34 | 58.58 | 62.05 |
| Camarilla | 45.71 | 46.51 | 47.31 | 48.11 | 48.91 | 49.70 | 50.50 |
| Woodie | 35.05 | 40.72 | 43.76 | 49.43 | 52.46 | 58.13 | 61.17 |
| Fibonacci | 41.16 | 44.49 | 46.54 | 49.87 | 53.20 | 55.25 | 58.58 |
Numerical data
The following is the status of the technical indicators and moving averages at the time of publication of this technical analysis:
| RSI (14): | 56.13 | |
| MACD (12,26,9): | 0.1800 | |
| Directional Movement: | 4.30 | |
| AROON (14): | -71.42 | |
| DEMA (21): | 52.16 | |
| Parabolic SAR (0,02-0,02-0,2): | 54.80 | |
| Elder Ray (13): | 0.76 | |
| Super Trend (3,10): | 47.81 | |
| Zig ZAG (10): | 53.25 | |
| VORTEX (21): | 0.9400 | |
| Stochastique (14,3,5): | 38.17 | |
| TEMA (21): | 52.00 | |
| Williams %R (14): | -37.68 | |
| Chande Momentum Oscillator (20): | -0.12 | |
| Repulse (5,40,3): | 3.6200 | |
| ROCnROLL: | 1 | |
| TRIX (15,9): | 0.0900 | |
| Courbe Coppock: | 0.14 |
| MA7: | 51.68 | |
| MA20: | 51.76 | |
| MA50: | 51.08 | |
| MA100: | 51.10 | |
| MAexp7: | 51.91 | |
| MAexp20: | 51.84 | |
| MAexp50: | 51.44 | |
| MAexp100: | 51.78 | |
| Price / MA7: | +3.04% | |
| Price / MA20: | +2.88% | |
| Price / MA50: | +4.25% | |
| Price / MA100: | +4.21% | |
| Price / MAexp7: | +2.58% | |
| Price / MAexp20: | +2.72% | |
| Price / MAexp50: | +3.52% | |
| Price / MAexp100: | +2.84% |
News
The latest news and videos published on RYDER SYSTEM INC. at the time of the analysis were as follows:
- Ryder Named as a Top Company for Women to Work For by Women in Trucking Association
- Ryder Awarded NACD NXT™ Recognition for Diversity and Inclusion Commitments
- Ryder Declares Quarterly Cash Dividend
- Ryder Third Quarter Conference Call Scheduled for October 29, 2019
- Ryder Opens First Alaskan One-Stop-Shop Maintenance, Leasing, and Rental Facility in Response to Growing Demand in the State
About author

Online


Add a comment
Comments
0 comments on the analysis RYDER SYSTEM INC. - Daily