| Open: | 2.688 |
| Change: | +0.684 |
| Volume: | 116 |
| Low: | 2.683 |
| High: | 3.386 |
| High / Low range: | 0.703 |
| Type: | Stocks |
| Ticker: | RWE |
| ISIN: | DE0007037129 |
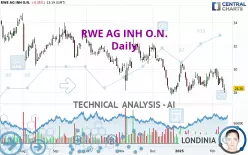
RWE AG INH O.N. - Daily - Technical analysis published on 02/13/2025 (GMT)
- 145
- 0
- 02/13/2025 - 13:35
Click here for a new analysis!
- Timeframe : Daily
- - Analysis generated on 02/13/2025 - 13:35
- Status : INVALID

Summary of the analysis

Additional analysis
Quotes
The RWE AG INH O.N. price is 28.35 EUR. The price registered a decrease of -0.35% on the session with the lowest point at 27.95 EUR and the highest point at 28.70 EUR. The deviation from the price is +1.43% for the low point and -1.22% for the high point.A bearish gap was detected at the opening by the Central Gaps scanner. There are a lot of sellers and they have the upper hand in the very short term.
Opening Gap DOWN
Type : Bearish
Timeframe : Openning
Here is a more detailed summary of the historical variations registered by RWE AG INH O.N.:
Near a new LOW record (1 year)
Type : Bearish
Timeframe : Weekly
New LOW record (1st january)
Type : Bearish
Timeframe : Weekly
Near a new HIGH record (1 month)
Type : Bullish
Timeframe : Weekly
New LOW record (1 month)
Type : Bearish
Timeframe : Weekly
Technical
A technical analysis in Daily of this RWE AG INH O.N. chart shows a sharp bearish trend. 92.86% of the signals given by moving averages are bearish. The overall trend is supported by the strong bearish signals from short-term moving averages. The Central Indicators market scanner is currently detecting a bearish signal that could impact this trend:
Bearish trend reversal : Moving Average 20
Type : Bearish
Timeframe : Daily
In fact, of the 18 technical indicators analysed by Central Analyzer, 4 are bullish, 4 are neutral and 10 are bearish. Caution: the Central Indicators scanner currently detects an excess:
CCI indicator is oversold : under -100
Type : Neutral
Timeframe : Daily
Central Patterns, the market scanner focusing on chart patterns, resistances and supports found this result:
Near support of channel
Type : Bullish
Timeframe : Daily
No result was found by the Central Candlesticks scanner on Japanese candlesticks.
| S3 | S2 | S1 | Price | R1 | R2 | R3 | |
|---|---|---|---|---|---|---|---|
| ProTrendLines | 24.82 | 26.58 | 28.03 | 28.35 | 29.44 | 30.41 | 31.96 |
| Change (%) | -12.45% | -6.24% | -1.13% | - | +3.84% | +7.27% | +12.73% |
| Change | -3.53 | -1.77 | -0.32 | - | +1.09 | +2.06 | +3.61 |
| Level | Major | Minor | Major | - | Major | Intermediate | Intermediate |
Pivot points can also be used to set your price objectives. Here is the price situation in relation to pivot points:
| Pivot points | S3 | S2 | S1 | PP | R1 | R2 | R3 |
|---|---|---|---|---|---|---|---|
| Standard | 27.10 | 27.74 | 28.09 | 28.73 | 29.08 | 29.72 | 30.07 |
| Camarilla | 28.18 | 28.27 | 28.36 | 28.45 | 28.54 | 28.63 | 28.72 |
| Woodie | 26.97 | 27.67 | 27.96 | 28.66 | 28.95 | 29.65 | 29.94 |
| Fibonacci | 27.74 | 28.12 | 28.35 | 28.73 | 29.11 | 29.34 | 29.72 |
| Pivot points | S3 | S2 | S1 | PP | R1 | R2 | R3 |
|---|---|---|---|---|---|---|---|
| Standard | 26.69 | 27.67 | 28.16 | 29.14 | 29.63 | 30.61 | 31.10 |
| Camarilla | 28.25 | 28.38 | 28.52 | 28.65 | 28.79 | 28.92 | 29.05 |
| Woodie | 26.45 | 27.55 | 27.92 | 29.02 | 29.39 | 30.49 | 30.86 |
| Fibonacci | 27.67 | 28.23 | 28.58 | 29.14 | 29.70 | 30.05 | 30.61 |
| Pivot points | S3 | S2 | S1 | PP | R1 | R2 | R3 |
|---|---|---|---|---|---|---|---|
| Standard | 25.89 | 26.93 | 28.41 | 29.45 | 30.93 | 31.97 | 33.45 |
| Camarilla | 29.19 | 29.42 | 29.65 | 29.88 | 30.11 | 30.34 | 30.57 |
| Woodie | 26.10 | 27.04 | 28.62 | 29.56 | 31.14 | 32.08 | 33.66 |
| Fibonacci | 26.93 | 27.90 | 28.49 | 29.45 | 30.42 | 31.01 | 31.97 |
Numerical data
The following is the status of technical indicators and moving averages registered at the time this technical analysis was created:
| RSI (14): | 41.06 | |
| MACD (12,26,9): | -0.1500 | |
| Directional Movement: | -9.45 | |
| AROON (14): | -35.71 | |
| DEMA (21): | 28.93 | |
| Parabolic SAR (0,02-0,02-0,2): | 30.09 | |
| Elder Ray (13): | -0.72 | |
| Super Trend (3,10): | 30.21 | |
| Zig ZAG (10): | 28.46 | |
| VORTEX (21): | 0.9300 | |
| Stochastique (14,3,5): | 21.57 | |
| TEMA (21): | 28.96 | |
| Williams %R (14): | -78.80 | |
| Chande Momentum Oscillator (20): | -0.60 | |
| Repulse (5,40,3): | -2.2600 | |
| ROCnROLL: | 2 | |
| TRIX (15,9): | -0.0300 | |
| Courbe Coppock: | 0.03 |
| MA7: | 29.01 | |
| MA20: | 29.17 | |
| MA50: | 29.42 | |
| MA100: | 30.34 | |
| MAexp7: | 28.87 | |
| MAexp20: | 29.11 | |
| MAexp50: | 29.49 | |
| MAexp100: | 30.14 | |
| Price / MA7: | -2.28% | |
| Price / MA20: | -2.81% | |
| Price / MA50: | -3.64% | |
| Price / MA100: | -6.56% | |
| Price / MAexp7: | -1.80% | |
| Price / MAexp20: | -2.61% | |
| Price / MAexp50: | -3.87% | |
| Price / MAexp100: | -5.94% |
News
The latest news and videos published on RWE AG INH O.N. at the time of the analysis were as follows:
- 12/09/2024 - 02:30 FPT and RWE Sign 5-Year Master Service Agreement to Drive Innovation and Sustainability
- 11/21/2024 - 12:45 RWE and Peabody Partner to Develop Solar and Energy Storage Pipeline on Repurposed, Reclaimed Mine Lands
- 11/21/2024 - 09:00 RWE to Harness AI-driven Weather Modelling With HPE Private Cloud AI
- 11/12/2024 - 21:42 EQS-Adhoc: RWE AG: Ad-hoc release in accordance with Art. 17 MAR RWE decides on share buyback program with a volume of up to EUR 1.5 billion
- 09/30/2024 - 08:00 MSD in Strategic collaboration with Briya for Innovative RWE data analysis projects
About author
Online


Add a comment
Comments
0 comments on the analysis RWE AG INH O.N. - Daily