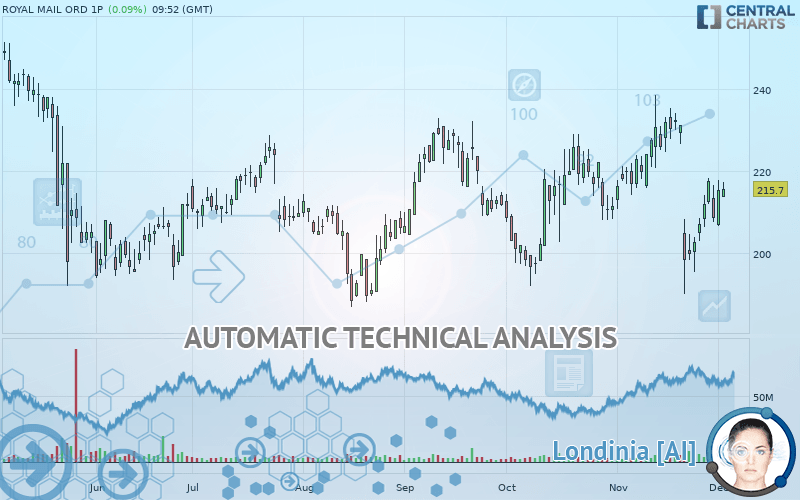
ROYAL MAIL ORD 1P - Daily - Technical analysis published on 12/03/2019 (GMT)
- 260
- 0
Click here for a new analysis!
- Timeframe : Daily
- - Analysis generated on
- Status : TARGET REACHED

Summary of the analysis
Additional analysis
Quotes
The ROYAL MAIL ORD 1P price is 215.70 GBX. The price registered an increase of +0.09% on the session and was between 213.80 GBX and 217.40 GBX. This implies that the price is at +0.89% from its lowest and at -0.78% from its highest.Here is a more detailed summary of the historical variations registered by ROYAL MAIL ORD 1P:
Technical
Technical analysis of ROYAL MAIL ORD 1P in Daily shows an overall bullish trend. 75% of the signals given by moving averages are bullish. Caution: the neutral signals currently given by short-term moving averages show us that the global trend is losing momentum. The Central Indicators scanner detects bullish signals on moving averages that could impact this trend:
Bullish price crossover with Moving Average 50
Type : Bullish
Timeframe : Daily
Bullish price crossover with Moving Average 100
Type : Bullish
Timeframe : Daily
Bullish price crossover with adaptative moving average 20
Type : Bullish
Timeframe : Daily
Bullish price crossover with adaptative moving average 50
Type : Bullish
Timeframe : Daily
Bullish price crossover with adaptative moving average 100
Type : Bullish
Timeframe : Daily
Technical indicators are slightly bullish. There is therefore considerable uncertainty about the continuation of the increase.
Caution: the Central Indicators scanner currently detects an excess:
Williams %R indicator is overbought : over -20
Type : Neutral
Timeframe : Daily
Ichimoku : price is over the cloud
Type : Bullish
Timeframe : Daily
Price is back over the pivot point
Type : Bullish
Timeframe : Daily
Price is back over the pivot point
Type : Bullish
Timeframe : Weekly
Williams %R indicator is back over -50
Type : Bullish
Timeframe : Daily
Central Patterns, the market scanner focusing on chart patterns, resistances and supports found this result:
Horizontal support is broken
Type : Bearish
Timeframe : Daily
The presence of a bullish Japanese candlestick pattern detected by Central Candlesticks that could cause a very short term rebound was also detected:
Bullish engulfing lines
Type : Bullish
Timeframe : Daily
| S3 | S2 | S1 | Price | R1 | R2 | R3 | |
|---|---|---|---|---|---|---|---|
| ProTrendLines | 188.40 | 195.90 | 210.64 | 215.70 | 230.83 | 248.75 | 268.50 |
| Change (%) | -12.66% | -9.18% | -2.35% | - | +7.01% | +15.32% | +24.48% |
| Change | -27.30 | -19.80 | -5.06 | - | +15.13 | +33.05 | +52.80 |
| Level | Intermediate | Major | Intermediate | - | Major | Minor | Minor |
To determine price objectives, it is also possible to use the pivot points. Here is the price position in relation to pivot points:
| Pivot points | S3 | S2 | S1 | PP | R1 | R2 | R3 |
|---|---|---|---|---|---|---|---|
| Standard | 197.77 | 202.23 | 208.87 | 213.33 | 219.97 | 224.43 | 231.07 |
| Camarilla | 212.45 | 213.47 | 214.48 | 215.50 | 216.52 | 217.54 | 218.55 |
| Woodie | 198.85 | 202.78 | 209.95 | 213.88 | 221.05 | 224.98 | 232.15 |
| Fibonacci | 202.23 | 206.47 | 209.09 | 213.33 | 217.57 | 220.19 | 224.43 |
| Pivot points | S3 | S2 | S1 | PP | R1 | R2 | R3 |
|---|---|---|---|---|---|---|---|
| Standard | 173.77 | 184.63 | 196.57 | 207.43 | 219.37 | 230.23 | 242.17 |
| Camarilla | 202.23 | 204.32 | 206.41 | 208.50 | 210.59 | 212.68 | 214.77 |
| Woodie | 174.30 | 184.90 | 197.10 | 207.70 | 219.90 | 230.50 | 242.70 |
| Fibonacci | 184.63 | 193.34 | 198.72 | 207.43 | 216.14 | 221.52 | 230.23 |
| Pivot points | S3 | S2 | S1 | PP | R1 | R2 | R3 |
|---|---|---|---|---|---|---|---|
| Standard | 137.92 | 164.03 | 186.27 | 212.38 | 234.62 | 260.73 | 282.97 |
| Camarilla | 195.20 | 199.64 | 204.07 | 208.50 | 212.93 | 217.36 | 221.80 |
| Woodie | 135.98 | 163.06 | 184.33 | 211.41 | 232.68 | 259.76 | 281.03 |
| Fibonacci | 164.03 | 182.50 | 193.91 | 212.38 | 230.85 | 242.26 | 260.73 |
Numerical data
The following is the status of the technical indicators and moving averages at the time of publication of this technical analysis:
| RSI (14): | 50.03 | |
| MACD (12,26,9): | -1.5300 | |
| Directional Movement: | -7.22 | |
| AROON (14): | -42.86 | |
| DEMA (21): | 214.31 | |
| Parabolic SAR (0,02-0,02-0,2): | 231.28 | |
| Elder Ray (13): | 0.81 | |
| Super Trend (3,10): | 230.64 | |
| Zig ZAG (10): | 216.10 | |
| VORTEX (21): | 1.0400 | |
| Stochastique (14,3,5): | 49.39 | |
| TEMA (21): | 211.98 | |
| Williams %R (14): | -42.21 | |
| Chande Momentum Oscillator (20): | -15.80 | |
| Repulse (5,40,3): | 4.2700 | |
| ROCnROLL: | 1 | |
| TRIX (15,9): | -0.0500 | |
| Courbe Coppock: | 12.14 |
| MA7: | 211.47 | |
| MA20: | 218.64 | |
| MA50: | 214.96 | |
| MA100: | 212.45 | |
| MAexp7: | 213.76 | |
| MAexp20: | 215.79 | |
| MAexp50: | 215.61 | |
| MAexp100: | 214.81 | |
| Price / MA7: | +2.00% | |
| Price / MA20: | -1.34% | |
| Price / MA50: | +0.34% | |
| Price / MA100: | +1.53% | |
| Price / MAexp7: | +0.91% | |
| Price / MAexp20: | -0.04% | |
| Price / MAexp50: | +0.04% | |
| Price / MAexp100: | +0.41% |
News
Don"t forget to follow the news on ROYAL MAIL ORD 1P. At the time of publication of this analysis, the latest news was as follows:
-
 What to expect from Royal Mail's H1 results
-
Fed and ECB minutes, flash PMIs, Canada data and easyJet and Royal Mail - 16 November 2019
-
Royal Mail update 'further recognition of its ongoing issues' - analyst Richard Hunter
-
Royal fail: Royal Mail mocked after Shakespeare celebration backfires
-
McDonnell: "We're taking back rail, water, energy & Royal Mail
About author

Online


Add a comment
Comments
0 comments on the analysis ROYAL MAIL ORD 1P - Daily