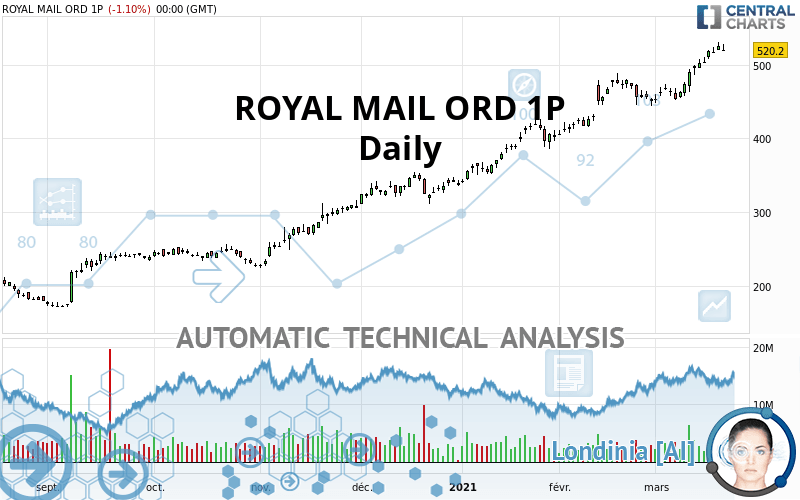
ROYAL MAIL ORD 1P - Daily - Technical analysis published on 03/21/2021 (GMT)
- 308
- 0
Click here for a new analysis!
- Timeframe : Daily
- - Analysis generated on
- Status : LEVEL MAINTAINED

Summary of the analysis
Additional analysis
Quotes
The ROYAL MAIL ORD 1P price is 520.2 GBX. The price is lower by -1.10% since the last closing and was traded between 518.0 GBX and 528.4 GBX over the period. The price is currently at +0.42% from its lowest and -1.55% from its highest.The Central Gaps scanner detects a bearish opening. A small advantage for sellers in the very short term.
Bearish opening
Type : Bearish
Timeframe : Openning
So that you have an overall view of the price change, here is a table showing the variations over several periods:
New HIGH record (1 year)
Type : Bullish
Timeframe : Weekly
New HIGH record (1st january)
Type : Bullish
Timeframe : Weekly
New HIGH record (1 month)
Type : Bullish
Timeframe : Weekly
Technical
A technical analysis in Daily of this ROYAL MAIL ORD 1P chart shows a strongly bullish trend. 92.86% of the signals given by moving averages are bullish. This strongly bullish trend is supported by the strong bullish signals given by short-term moving averages. The Central Indicators market scanner currently does not detect any result that concerns moving averages.
The probability of a further increase is high given the direction of the technical indicators.
Caution: the Central Indicators scanner currently detects an excess:
RSI indicator is overbought : over 70
Type : Neutral
Timeframe : Daily
CCI indicator is overbought : over 100
Type : Neutral
Timeframe : Daily
Previous candle closed over Bollinger bands
Type : Neutral
Timeframe : Daily
CCI indicator: bearish divergence
Type : Bearish
Timeframe : Daily
MACD indicator: bullish divergence
Type : Bullish
Timeframe : Daily
Williams %R indicator is overbought : over -20
Type : Neutral
Timeframe : Daily
Pivot points : price is over resistance 2
Type : Neutral
Timeframe : Daily
Pivot points : price is over resistance 3
Type : Neutral
Timeframe : Weekly
Price is back under the pivot point
Type : Bearish
Timeframe : Daily
Price is back under the pivot point
Type : Bearish
Timeframe : Weekly
The analysis of the price chart with Central Patterns scanners does not return any result.
No result was found by the Central Candlesticks scanner on Japanese candlesticks.
| S3 | S2 | S1 | Price | R1 | R2 | |
|---|---|---|---|---|---|---|
| ProTrendLines | 370.0 | 452.7 | 489.0 | 520.2 | 570.0 | 631.0 |
| Change (%) | -28.87% | -12.98% | -6.00% | - | +9.57% | +21.30% |
| Change | -150.2 | -67.5 | -31.2 | - | +49.8 | +110.8 |
| Level | Major | Major | Minor | - | Minor | Major |
To determine price objectives, it is also possible to use the pivot points. Here is the price position in relation to pivot points:
| Pivot points | S3 | S2 | S1 | PP | R1 | R2 | R3 |
|---|---|---|---|---|---|---|---|
| Standard | 505.6 | 511.8 | 516.0 | 522.2 | 526.4 | 532.6 | 536.8 |
| Camarilla | 517.3 | 518.3 | 519.3 | 520.2 | 521.2 | 522.1 | 523.1 |
| Woodie | 504.6 | 511.3 | 515.0 | 521.7 | 525.4 | 532.1 | 535.8 |
| Fibonacci | 511.8 | 515.8 | 518.2 | 522.2 | 526.2 | 528.6 | 532.6 |
| Pivot points | S3 | S2 | S1 | PP | R1 | R2 | R3 |
|---|---|---|---|---|---|---|---|
| Standard | 475.7 | 488.9 | 504.5 | 517.7 | 533.3 | 546.5 | 562.1 |
| Camarilla | 512.3 | 514.9 | 517.6 | 520.2 | 522.8 | 525.5 | 528.1 |
| Woodie | 477.0 | 489.5 | 505.8 | 518.3 | 534.6 | 547.1 | 563.4 |
| Fibonacci | 488.9 | 499.9 | 506.7 | 517.7 | 528.7 | 535.5 | 546.5 |
| Pivot points | S3 | S2 | S1 | PP | R1 | R2 | R3 |
|---|---|---|---|---|---|---|---|
| Standard | 325.2 | 364.8 | 408.8 | 448.4 | 492.4 | 532.0 | 576.0 |
| Camarilla | 429.7 | 437.4 | 445.0 | 452.7 | 460.4 | 468.0 | 475.7 |
| Woodie | 327.3 | 365.9 | 410.9 | 449.5 | 494.5 | 533.1 | 578.1 |
| Fibonacci | 364.8 | 396.8 | 416.5 | 448.4 | 480.4 | 500.1 | 532.0 |
Numerical data
The following is the status of technical indicators and moving averages registered at the time this technical analysis was created:
| RSI (14): | 76.50 | |
| MACD (12,26,9): | 21.0000 | |
| Directional Movement: | 26.7 | |
| AROON (14): | 92.9 | |
| DEMA (21): | 505.2 | |
| Parabolic SAR (0,02-0,02-0,2): | 466.7 | |
| Elder Ray (13): | 30.9 | |
| Super Trend (3,10): | 476.8 | |
| Zig ZAG (10): | 517.8 | |
| VORTEX (21): | 1.1000 | |
| Stochastique (14,3,5): | 93.70 | |
| TEMA (21): | 507.7 | |
| Williams %R (14): | -7.50 | |
| Chande Momentum Oscillator (20): | 64.3 | |
| Repulse (5,40,3): | 2.4000 | |
| ROCnROLL: | 1 | |
| TRIX (15,9): | 0.6000 | |
| Courbe Coppock: | 15.90 |
| MA7: | 500.2 | |
| MA20: | 475.7 | |
| MA50: | 436.3 | |
| MA100: | 368.7 | |
| MAexp7: | 501.3 | |
| MAexp20: | 478.0 | |
| MAexp50: | 437.6 | |
| MAexp100: | 383.5 | |
| Price / MA7: | +4.00% | |
| Price / MA20: | +9.35% | |
| Price / MA50: | +19.23% | |
| Price / MA100: | +41.09% | |
| Price / MAexp7: | +3.77% | |
| Price / MAexp20: | +8.83% | |
| Price / MAexp50: | +18.88% | |
| Price / MAexp100: | +35.65% |
News
Don"t forget to follow the news on ROYAL MAIL ORD 1P. At the time of publication of this analysis, the latest news was as follows:
-
 What to expect from Royal Mail's H1 results
-
Fed and ECB minutes, flash PMIs, Canada data and easyJet and Royal Mail - 16 November 2019
-
Royal Mail update 'further recognition of its ongoing issues' - analyst Richard Hunter
-
Royal fail: Royal Mail mocked after Shakespeare celebration backfires
-
McDonnell: "We're taking back rail, water, energy & Royal Mail
About author

Online


Add a comment
Comments
0 comments on the analysis ROYAL MAIL ORD 1P - Daily