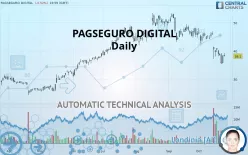
PAGSEGURO DIGITAL - Daily - Technical analysis published on 10/25/2019 (GMT)
- 242
- 0
- Who voted?
Click here for a new analysis!
- Timeframe : Daily
- - Analysis generated on
- Status : TARGET REACHED

Summary of the analysis

Additional analysis
Quotes
The PAGSEGURO DIGITAL rating is 38.10 USD. The price registered a decrease of -0.52% on the session and was between 37.86 USD and 39.22 USD. This implies that the price is at +0.63% from its lowest and at -2.86% from its highest.The Central Gaps scanner detects a bullish gap which is a sign that buyers have taken the lead in the very short term.
Opening Gap UP
Type : Bullish
Timeframe : Openning
Here is a more detailed summary of the historical variations registered by PAGSEGURO DIGITAL:
Technical
A technical analysis in Daily of this PAGSEGURO DIGITAL chart shows a bearish trend. 75% of the signals given by moving averages are bearish. This bearish trend is supported by the strong bearish signals given by short-term moving averages. The Central Indicators market scanner currently does not detect any result that concerns moving averages.
The technical indicators are generally neutral. They do not provide relevant information on the direction of future price movements.
Caution: the Central Indicators scanner currently detects an excess:
CCI indicator is oversold : under -100
Type : Neutral
Timeframe : Daily
Previous candle closed under Bollinger bands
Type : Neutral
Timeframe : Daily
CCI indicator: bullish divergence
Type : Bullish
Timeframe : Daily
Price is back over the pivot point
Type : Bullish
Timeframe : Daily
Price is back under the pivot point
Type : Bearish
Timeframe : Weekly
The Central Patterns scanner, which studies chart patterns, resistances and supports, has identified these signals:
Horizontal support is broken
Type : Bearish
Timeframe : Daily
Support of channel is broken
Type : Bearish
Timeframe : Daily
For a small rebound in the very short term, the Central Candlesticks scanner currently notes the presence of this bullish pattern in Japanese candlesticks:
Bullish harami
Type : Bullish
Timeframe : Daily
| S3 | S2 | S1 | Price | R1 | R2 | R3 | |
|---|---|---|---|---|---|---|---|
| ProTrendLines | 25.43 | 30.84 | 36.97 | 38.10 | 44.14 | 48.40 | 52.88 |
| Change (%) | -33.25% | -19.06% | -2.97% | - | +15.85% | +27.03% | +38.79% |
| Change | -12.67 | -7.26 | -1.13 | - | +6.04 | +10.30 | +14.78 |
| Level | Major | Major | Intermediate | - | Major | Intermediate | Intermediate |
Pivot points can also be used to set your price objectives. Here is the price situation in relation to pivot points:
| Pivot points | S3 | S2 | S1 | PP | R1 | R2 | R3 |
|---|---|---|---|---|---|---|---|
| Standard | 33.46 | 34.45 | 36.38 | 37.37 | 39.30 | 40.29 | 42.22 |
| Camarilla | 37.50 | 37.77 | 38.03 | 38.30 | 38.57 | 38.84 | 39.10 |
| Woodie | 33.92 | 34.69 | 36.84 | 37.61 | 39.76 | 40.53 | 42.68 |
| Fibonacci | 34.45 | 35.57 | 36.26 | 37.37 | 38.49 | 39.18 | 40.29 |
| Pivot points | S3 | S2 | S1 | PP | R1 | R2 | R3 |
|---|---|---|---|---|---|---|---|
| Standard | 25.23 | 31.19 | 35.02 | 40.98 | 44.81 | 50.77 | 54.60 |
| Camarilla | 36.16 | 37.06 | 37.95 | 38.85 | 39.75 | 40.65 | 41.54 |
| Woodie | 24.17 | 30.66 | 33.96 | 40.45 | 43.75 | 50.24 | 53.54 |
| Fibonacci | 31.19 | 34.93 | 37.24 | 40.98 | 44.72 | 47.03 | 50.77 |
| Pivot points | S3 | S2 | S1 | PP | R1 | R2 | R3 |
|---|---|---|---|---|---|---|---|
| Standard | 31.62 | 37.38 | 41.84 | 47.60 | 52.06 | 57.82 | 62.28 |
| Camarilla | 43.50 | 44.44 | 45.37 | 46.31 | 47.25 | 48.18 | 49.12 |
| Woodie | 30.98 | 37.06 | 41.20 | 47.28 | 51.42 | 57.50 | 61.64 |
| Fibonacci | 37.38 | 41.28 | 43.69 | 47.60 | 51.50 | 53.91 | 57.82 |
Numerical data
The following is the status of technical indicators and moving averages registered at the time this technical analysis was created:
| RSI (14): | 37.37 | |
| MACD (12,26,9): | -2.3900 | |
| Directional Movement: | -22.69 | |
| AROON (14): | -42.85 | |
| DEMA (21): | 39.05 | |
| Parabolic SAR (0,02-0,02-0,2): | 45.32 | |
| Elder Ray (13): | -2.01 | |
| Super Trend (3,10): | 44.59 | |
| Zig ZAG (10): | 38.10 | |
| VORTEX (21): | 0.9100 | |
| Stochastique (14,3,5): | 17.71 | |
| TEMA (21): | 37.41 | |
| Williams %R (14): | -75.75 | |
| Chande Momentum Oscillator (20): | -6.17 | |
| Repulse (5,40,3): | -1.1800 | |
| ROCnROLL: | 2 | |
| TRIX (15,9): | -0.5700 | |
| Courbe Coppock: | 29.13 |
| MA7: | 38.54 | |
| MA20: | 42.73 | |
| MA50: | 46.30 | |
| MA100: | 43.93 | |
| MAexp7: | 38.96 | |
| MAexp20: | 41.90 | |
| MAexp50: | 43.91 | |
| MAexp100: | 42.29 | |
| Price / MA7: | -1.14% | |
| Price / MA20: | -10.84% | |
| Price / MA50: | -17.71% | |
| Price / MA100: | -13.27% | |
| Price / MAexp7: | -2.21% | |
| Price / MAexp20: | -9.07% | |
| Price / MAexp50: | -13.23% | |
| Price / MAexp100: | -9.91% |
News
The latest news and videos published on PAGSEGURO DIGITAL at the time of the analysis were as follows:
About author

Online


Add a comment
Comments
0 comments on the analysis PAGSEGURO DIGITAL - Daily