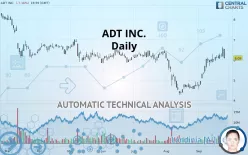
ADT INC. - Daily - Technical analysis published on 09/27/2019 (GMT)
- 364
- 0
- Who voted?
Click here for a new analysis!
- Timeframe : Daily
- - Analysis generated on
- Status : TARGET REACHED

Summary of the analysis

Additional analysis
Quotes
ADT INC. rating 6.09 USD. The price is lower by -7.17% since the last closing and was traded between 6.06 USD and 6.53 USD over the period. The price is currently at +0.50% from its lowest and -6.74% from its highest.The Central Gaps scanner detects a bearish opening marking the presence of sellers ahead of buyers at the opening but not sufficiently marked to allow the price to register a quotation gap.
Bearish opening
Type : Bearish
Timeframe : Openning
A study of price movements over other periods shows the following variations:
Near a new HIGH record (1 month)
Type : Bullish
Timeframe : Weekly
Technical
Technical analysis of ADT INC. in Daily shows an overall slightly bullish trend. Only 60.71% of the signals given by moving averages are bullish. This slightly bullish trend is reinforced by the strong signals currently being given by short-term moving averages. The Central Indicators market scanner currently does not detect any result that concerns moving averages.
In fact, 11 technical indicators on 18 studied are currently bullish. Caution: the Central Indicators scanner currently detects an excess:
RSI indicator is overbought : over 70
Type : Neutral
Timeframe : Daily
CCI indicator is overbought : over 100
Type : Neutral
Timeframe : Daily
Williams %R indicator is overbought : over -20
Type : Neutral
Timeframe : Daily
Pivot points : price is under support 1
Type : Neutral
Timeframe : Daily
Price is back over the pivot point
Type : Bullish
Timeframe : Daily
Price is back over the pivot point
Type : Bullish
Timeframe : Weekly
Central Patterns, the market scanner focusing on chart patterns, resistances and supports found these results:
Resistance of channel is broken
Type : Bullish
Timeframe : Daily
Horizontal support is broken
Type : Bearish
Timeframe : Daily
For a small rebound in the very short term, the Central Candlesticks scanner currently notes the presence of this bullish pattern in Japanese candlesticks:
Bullish engulfing lines
Type : Bullish
Timeframe : Daily
| S2 | S1 | Price | R1 | R2 | R3 | |
|---|---|---|---|---|---|---|
| ProTrendLines | 4.35 | 5.86 | 6.09 | 6.47 | 6.99 | 7.33 |
| Change (%) | -28.57% | -3.78% | - | +6.24% | +14.78% | +20.36% |
| Change | -1.74 | -0.23 | - | +0.38 | +0.90 | +1.24 |
| Level | Minor | Intermediate | - | Intermediate | Intermediate | Minor |
Pivot points can also be used to set your price objectives. Here is the price situation in relation to pivot points:
| Pivot points | S3 | S2 | S1 | PP | R1 | R2 | R3 |
|---|---|---|---|---|---|---|---|
| Standard | 5.78 | 5.98 | 6.27 | 6.46 | 6.75 | 6.95 | 7.24 |
| Camarilla | 6.43 | 6.47 | 6.52 | 6.56 | 6.60 | 6.65 | 6.69 |
| Woodie | 5.83 | 6.00 | 6.32 | 6.49 | 6.80 | 6.97 | 7.29 |
| Fibonacci | 5.98 | 6.16 | 6.28 | 6.46 | 6.65 | 6.76 | 6.95 |
| Pivot points | S3 | S2 | S1 | PP | R1 | R2 | R3 |
|---|---|---|---|---|---|---|---|
| Standard | 5.51 | 5.69 | 5.90 | 6.08 | 6.29 | 6.47 | 6.68 |
| Camarilla | 5.99 | 6.03 | 6.06 | 6.10 | 6.14 | 6.17 | 6.21 |
| Woodie | 5.52 | 5.70 | 5.91 | 6.09 | 6.30 | 6.48 | 6.69 |
| Fibonacci | 5.69 | 5.84 | 5.93 | 6.08 | 6.23 | 6.32 | 6.47 |
| Pivot points | S3 | S2 | S1 | PP | R1 | R2 | R3 |
|---|---|---|---|---|---|---|---|
| Standard | 1.67 | 2.95 | 3.84 | 5.11 | 6.00 | 7.28 | 8.17 |
| Camarilla | 4.13 | 4.33 | 4.53 | 4.73 | 4.93 | 5.12 | 5.32 |
| Woodie | 1.48 | 2.85 | 3.64 | 5.01 | 5.81 | 7.18 | 7.97 |
| Fibonacci | 2.95 | 3.77 | 4.28 | 5.11 | 5.94 | 6.45 | 7.28 |
Numerical data
The following is the status of technical indicators and moving averages registered at the time this technical analysis was created:
| RSI (14): | 59.11 | |
| MACD (12,26,9): | 0.2900 | |
| Directional Movement: | 21.97 | |
| AROON (14): | 92.86 | |
| DEMA (21): | 6.19 | |
| Parabolic SAR (0,02-0,02-0,2): | 6.66 | |
| Elder Ray (13): | 0.28 | |
| Super Trend (3,10): | 5.64 | |
| Zig ZAG (10): | 6.09 | |
| VORTEX (21): | 1.2400 | |
| Stochastique (14,3,5): | 80.88 | |
| TEMA (21): | 6.47 | |
| Williams %R (14): | -42.08 | |
| Chande Momentum Oscillator (20): | 0.04 | |
| Repulse (5,40,3): | -3.8600 | |
| ROCnROLL: | 1 | |
| TRIX (15,9): | 0.6800 | |
| Courbe Coppock: | 40.98 |
| MA7: | 6.21 | |
| MA20: | 5.74 | |
| MA50: | 5.49 | |
| MA100: | 5.81 | |
| MAexp7: | 6.18 | |
| MAexp20: | 5.84 | |
| MAexp50: | 5.66 | |
| MAexp100: | 5.86 | |
| Price / MA7: | -1.93% | |
| Price / MA20: | +6.10% | |
| Price / MA50: | +10.93% | |
| Price / MA100: | +4.82% | |
| Price / MAexp7: | -1.46% | |
| Price / MAexp20: | +4.28% | |
| Price / MAexp50: | +7.60% | |
| Price / MAexp100: | +3.92% |
About author

Online


Add a comment
Comments
0 comments on the analysis ADT INC. - Daily