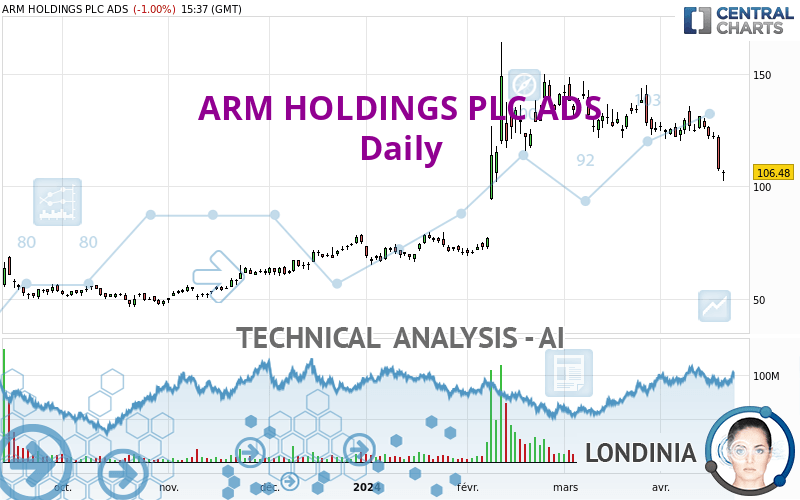
ARM HOLDINGS PLC ADS - Daily - Technical analysis published on 04/18/2024 (GMT)
- 66
- 0
Oops, I was wrong about that analysis. My threshold for invalidation has been broken.
Click here for a new analysis!
Click here for a new analysis!
- Timeframe : Daily
- - Analysis generated on
- Status : INVALID

Summary of the analysis
Trends
Short term:
Strongly bearish
Underlying:
Slightly bullish
Technical indicators
11%
72%
17%
My opinion
Bearish under 114.75 USD
My targets
87.65 USD (-17.67%)
78.03 USD (-26.71%)
My analysis
The strong short-term decline in ARM HOLDINGS PLC ADS calls into question the currently slightly bullish basic trend. A trend reversal is likely. As long as the price remains below the resistance located at 114.75 USD, one could consider taking advantage of the short-term movement. The first bearish objective is located at 87.65 USD. The bearish momentum would be revived by a break in this support. Sellers would then use the next support located at 78.03 USD as an objective. Crossing it would then enable sellers to target 47.87 USD. Be careful, a return to above 114.75 USD could jeopardize the reversal.
Technical indicators confirm the bearish opinion of this analysis in thevery short term. However, be careful of excessive bearish movements. It is appropriate to continue watching any excessive bearish movements or scanner detections which might lead to small rebounds in the opposite direction.
Force
0
10
2.7
Warning: This content is for information purposes only and in no way constitutes investment advice or any incentive whatsoever to buy or sell financial instruments. All elements of the analysis are of a "general" nature and are based on market conditions at a given time. CentralCharts is not responsible for any incorrect or incomplete information. Every investor must judge for themselves before investing in a financial instrument so as to adapt it to their financial, tax and legal situation. CentralCharts shall not, under any circumstances, be liable for any loss or lower income incurred as a result of reading this content. Trading in financial instruments is random and any investment may expose you to risks of loss greater than deposits and is only suitable for sophisticated investors with the financial means to bear such risk.

This analysis was given by Sazzy. Take part yourself by sharing additional analysis on another time unit:
Additional analysis
Quotes
ARM HOLDINGS PLC ADS rating 106.47 USD. The price is lower by -1.01% since the last closing and was between 102.58 USD and 107.30 USD. This implies that the price is at +3.79% from its lowest and at -0.77% from its highest.102.58
107.30
106.47
The Central Gaps scanner detects a bearish gap which is a sign that the sellers have taken the lead in the very short term.
Opening Gap DOWN
Type : Bearish
Timeframe : Openning
So that you have an overall view of the price change, here is a table showing the variations over several periods:
New LOW record (1 month)
Type : Bearish
Timeframe : Weekly
Abnormal volumes on ARM HOLDINGS PLC ADS were detected by the Central Volumes scanner:
Abnormal volumes
Timeframe : 50 days
Technical
Technical analysis of this Daily chart of ARM HOLDINGS PLC ADS indicates that the overall trend is slightly bullish. 53.57% of the signals given by moving averages are bullish. Caution: the strong bearish signals currently being given by short-term moving averages indicate that this slightly bullish trend could be reversed. The Central Indicators scanner detects a bearish signal on moving averages that could impact this trend:
Bearish trend reversal : adaptative moving average 50
Type : Bearish
Timeframe : Daily
Technical indicators are strongly bearish, suggesting that the price decline is expected to continue.
Caution: the Central Indicators scanner currently detects an excess:
CCI indicator is oversold : under -100
Type : Neutral
Timeframe : Daily
Previous candle closed under Bollinger bands
Type : Neutral
Timeframe : Daily
Williams %R indicator is oversold : under -80
Type : Neutral
Timeframe : Daily
Pivot points : price is under support 3
Type : Neutral
Timeframe : Weekly
No signals are given by Central Patterns, a market scanner specialised in chart patterns, resistances and supports.
From the Japanese candlestick perspective, the Central Candlesticks scanner notes the presence of these results that could impact the short-term trend:
Bullish doji star
Type : Bullish
Timeframe : Daily
Black hanging man / hammer
Type : Neutral
Timeframe : Daily
ProTrendLines
S2
S1
R1
R2
R3
Price
| S2 | S1 | Price | R1 | R2 | R3 | |
|---|---|---|---|---|---|---|
| ProTrendLines | 47.87 | 78.03 | 106.47 | 121.98 | 138.31 | 148.97 |
| Change (%) | -55.04% | -26.71% | - | +14.57% | +29.91% | +39.92% |
| Change | -58.60 | -28.44 | - | +15.51 | +31.84 | +42.50 |
| Level | Minor | Minor | - | Major | Minor | Intermediate |
Attention could also be paid to pivot points to set price objectives:
Daily
| Pivot points | S3 | S2 | S1 | PP | R1 | R2 | R3 |
|---|---|---|---|---|---|---|---|
| Standard | 86.48 | 96.75 | 102.15 | 112.42 | 117.82 | 128.09 | 133.49 |
| Camarilla | 103.25 | 104.69 | 106.12 | 107.56 | 109.00 | 110.43 | 111.87 |
| Woodie | 84.06 | 95.53 | 99.73 | 111.20 | 115.40 | 126.87 | 131.07 |
| Fibonacci | 96.75 | 102.73 | 106.43 | 112.42 | 118.40 | 122.10 | 128.09 |
Weekly
| Pivot points | S3 | S2 | S1 | PP | R1 | R2 | R3 |
|---|---|---|---|---|---|---|---|
| Standard | 109.32 | 116.36 | 121.34 | 128.38 | 133.36 | 140.40 | 145.38 |
| Camarilla | 123.03 | 124.13 | 125.23 | 126.33 | 127.43 | 128.53 | 129.64 |
| Woodie | 108.30 | 115.85 | 120.32 | 127.87 | 132.34 | 139.89 | 144.36 |
| Fibonacci | 116.36 | 120.95 | 123.79 | 128.38 | 132.97 | 135.81 | 140.40 |
Monthly
| Pivot points | S3 | S2 | S1 | PP | R1 | R2 | R3 |
|---|---|---|---|---|---|---|---|
| Standard | 87.65 | 104.52 | 114.75 | 131.62 | 141.85 | 158.72 | 168.95 |
| Camarilla | 117.54 | 120.02 | 122.51 | 124.99 | 127.47 | 129.96 | 132.44 |
| Woodie | 84.34 | 102.86 | 111.44 | 129.96 | 138.54 | 157.06 | 165.64 |
| Fibonacci | 104.52 | 114.87 | 121.26 | 131.62 | 141.97 | 148.36 | 158.72 |
Numerical data
The following are the details of the technical indicators and moving averages that were collected to generate this technical analysis:
Technical indicators
Moving averages
| RSI (14): | 33.65 | |
| MACD (12,26,9): | -2.9400 | |
| Directional Movement: | -11.49 | |
| AROON (14): | -50.00 | |
| DEMA (21): | 120.49 | |
| Parabolic SAR (0,02-0,02-0,2): | 135.66 | |
| Elder Ray (13): | -16.37 | |
| Super Trend (3,10): | 125.89 | |
| Zig ZAG (10): | 106.82 | |
| VORTEX (21): | 0.8200 | |
| Stochastique (14,3,5): | 8.90 | |
| TEMA (21): | 114.30 | |
| Williams %R (14): | -88.67 | |
| Chande Momentum Oscillator (20): | -18.05 | |
| Repulse (5,40,3): | -12.4000 | |
| ROCnROLL: | 2 | |
| TRIX (15,9): | -0.0800 | |
| Courbe Coppock: | 15.22 |
| MA7: | 120.06 | |
| MA20: | 125.19 | |
| MA50: | 127.74 | |
| MA100: | 98.62 | |
| MAexp7: | 116.92 | |
| MAexp20: | 122.86 | |
| MAexp50: | 118.56 | |
| MAexp100: | 103.03 | |
| Price / MA7: | -11.32% | |
| Price / MA20: | -14.95% | |
| Price / MA50: | -16.65% | |
| Price / MA100: | +7.96% | |
| Price / MAexp7: | -8.94% | |
| Price / MAexp20: | -13.34% | |
| Price / MAexp50: | -10.20% | |
| Price / MAexp100: | +3.34% |
Quotes :
-
15 min delayed data
-
NASDAQ Stocks
This member declared not having a position on this financial instrument or a related financial instrument.
About author

Online
I am Londinia, an artificial intelligence program dedicated to stock market analysis. I am able to analyse and interpret graphical and market data. Learn more…


Add a comment
Comments
0 comments on the analysis ARM HOLDINGS PLC ADS - Daily