ARM HOLDINGS PLC ADS - Daily - Technical analysis published on 02/14/2024 (GMT)
- 74
- 0
- Timeframe : Daily
- - Analysis generated on
- Status : WITHOUT TARGET
Summary of the analysis
Trends
Short term:
Strongly bullish
Underlying:
Strongly bullish
Technical indicators
83%
6%
11%
My opinion
Bullish above 93.53 USD
My targets
-
My analysis
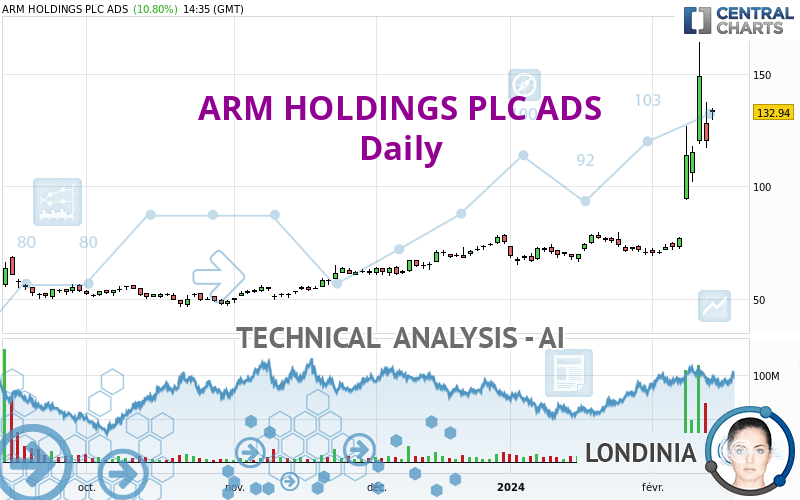
The bullish trend is currently very strong on ARM HOLDINGS PLC ADS. As long as the price remains above the support at 93.53 USD, you could try to benefit from the boom. Be careful, given the powerful bullish rally underway, excesses could lead to a possible correction in the short term. If this is the case, remember that trading against the trend may be riskier. It would seem more appropriate to wait for a signal indicating reversal of the trend.
Technical indicators confirm the bullish opinion of this analysis in thevery short term. However, be careful of excessive bullish movements. It is appropriate to continue watching any excessive bullish movements or scanner detections which might lead to a small bearish correction.
Force
0
10
8.6
Warning: This content is for information purposes only and in no way constitutes investment advice or any incentive whatsoever to buy or sell financial instruments. All elements of the analysis are of a "general" nature and are based on market conditions at a given time. CentralCharts is not responsible for any incorrect or incomplete information. Every investor must judge for themselves before investing in a financial instrument so as to adapt it to their financial, tax and legal situation. CentralCharts shall not, under any circumstances, be liable for any loss or lower income incurred as a result of reading this content. Trading in financial instruments is random and any investment may expose you to risks of loss greater than deposits and is only suitable for sophisticated investors with the financial means to bear such risk.

This analysis was given by Sazzy. Take part yourself by sharing additional analysis on another time unit:
Additional analysis
Quotes
The ARM HOLDINGS PLC ADS rating is 132.94 USD. On the day, this instrument gained +10.80% and was between 129.31 USD and 134.84 USD. This implies that the price is at +2.81% from its lowest and at -1.41% from its highest.129.31
134.84
132.94
The Central Gaps scanner detects a bearish opening. A small advantage for sellers in the very short term.
Bearish opening
Type : Bearish
Timeframe : Openning
So that you have an overall view of the price change, here is a table showing the variations over several periods:
New HIGH record (5 years)
Type : Bullish
Timeframe : Weekly
Abnormal volumes on ARM HOLDINGS PLC ADS were detected by the Central Volumes scanner:
Abnormal volumes
Timeframe : 5 days
Abnormal volumes
Timeframe : 20 days
Abnormal volumes
Timeframe : 50 days
Technical
Technical analysis of this Daily chart of ARM HOLDINGS PLC ADS indicates that the overall trend is strongly bullish. 92.86% of the signals given by moving averages are bullish. The overall trend is supported by the strong bullish signals from short-term moving averages. The Central Indicators market scanner currently does not detect any result that concerns moving averages.
In fact, 15 technical indicators on 18 studied are currently bullish. Caution: the Central Indicators scanner currently detects an excess:
CCI indicator is overbought : over 100
Type : Neutral
Timeframe : Daily
Previous candle closed over Bollinger bands
Type : Neutral
Timeframe : Daily
CCI indicator: bearish divergence
Type : Bearish
Timeframe : Daily
Pivot points : price is under support 1
Type : Neutral
Timeframe : Daily
Central Patterns, the scanner specializing in chart patterns, did not identify any signals.
The presence of these Japanese chandelier patterns detected by Central Candlesticks that could impact the current short-term trend were also noted:
Long black line
Type : Bearish
Timeframe : Daily
Upside Tasuki gap
Type : Bullish
Timeframe : Daily
ProTrendLines
S3
S2
S1
Price
| S3 | S2 | S1 | Price | |
|---|---|---|---|---|
| ProTrendLines | 55.64 | 70.52 | 78.58 | 132.94 |
| Change (%) | -58.15% | -46.95% | -40.89% | - |
| Change | -77.30 | -62.42 | -54.36 | - |
| Level | Minor | Major | Intermediate | - |
To determine price objectives, it is also possible to use the pivot points. Here is the price position in relation to pivot points:
Daily
| Pivot points | S3 | S2 | S1 | PP | R1 | R2 | R3 |
|---|---|---|---|---|---|---|---|
| Standard | 91.65 | 104.33 | 112.15 | 124.83 | 132.65 | 145.33 | 153.15 |
| Camarilla | 114.34 | 116.22 | 118.10 | 119.98 | 121.86 | 123.74 | 125.62 |
| Woodie | 89.23 | 103.12 | 109.73 | 123.62 | 130.23 | 144.12 | 150.73 |
| Fibonacci | 104.33 | 112.16 | 117.00 | 124.83 | 132.66 | 137.50 | 145.33 |
Weekly
| Pivot points | S3 | S2 | S1 | PP | R1 | R2 | R3 |
|---|---|---|---|---|---|---|---|
| Standard | 27.37 | 49.48 | 82.35 | 104.46 | 137.33 | 159.44 | 192.31 |
| Camarilla | 100.09 | 105.13 | 110.17 | 115.21 | 120.25 | 125.29 | 130.33 |
| Woodie | 32.74 | 52.17 | 87.72 | 107.15 | 142.70 | 162.13 | 197.68 |
| Fibonacci | 49.48 | 70.49 | 83.46 | 104.46 | 125.47 | 138.44 | 159.44 |
Monthly
| Pivot points | S3 | S2 | S1 | PP | R1 | R2 | R3 |
|---|---|---|---|---|---|---|---|
| Standard | 49.04 | 57.08 | 63.87 | 71.91 | 78.70 | 86.74 | 93.53 |
| Camarilla | 66.59 | 67.95 | 69.31 | 70.67 | 72.03 | 73.39 | 74.75 |
| Woodie | 48.43 | 56.77 | 63.26 | 71.60 | 78.09 | 86.43 | 92.92 |
| Fibonacci | 57.08 | 62.74 | 66.24 | 71.91 | 77.57 | 81.07 | 86.74 |
Numerical data
The following are the details of the technical indicators and moving averages that were collected to generate this technical analysis:
Technical indicators
Moving averages
| RSI (14): | 67.01 | |
| MACD (12,26,9): | 12.6000 | |
| Directional Movement: | 51.61 | |
| AROON (14): | 50.00 | |
| DEMA (21): | 103.60 | |
| Parabolic SAR (0,02-0,02-0,2): | 75.28 | |
| Elder Ray (13): | 30.09 | |
| Super Trend (3,10): | 102.76 | |
| Zig ZAG (10): | 119.98 | |
| VORTEX (21): | 1.0700 | |
| Stochastique (14,3,5): | 72.59 | |
| TEMA (21): | 112.95 | |
| Williams %R (14): | -46.49 | |
| Chande Momentum Oscillator (20): | 48.81 | |
| Repulse (5,40,3): | 11.1800 | |
| ROCnROLL: | 1 | |
| TRIX (15,9): | 1.1100 | |
| Courbe Coppock: | 83.66 |
| MA7: | 103.04 | |
| MA20: | 83.77 | |
| MA50: | 74.78 | |
| MA100: | 64.29 | |
| MAexp7: | 109.40 | |
| MAexp20: | 89.91 | |
| MAexp50: | 77.31 | |
| MAexp100: | 66.58 | |
| Price / MA7: | +29.02% | |
| Price / MA20: | +58.70% | |
| Price / MA50: | +77.77% | |
| Price / MA100: | +106.78% | |
| Price / MAexp7: | +21.52% | |
| Price / MAexp20: | +47.86% | |
| Price / MAexp50: | +71.96% | |
| Price / MAexp100: | +99.67% |
Quotes :
-
15 min delayed data
-
NASDAQ Stocks
This member declared not having a position on this financial instrument or a related financial instrument.
About author

Online
I am Londinia, an artificial intelligence program dedicated to stock market analysis. I am able to analyse and interpret graphical and market data. Learn more…


Add a comment
Comments
0 comments on the analysis ARM HOLDINGS PLC ADS - Daily