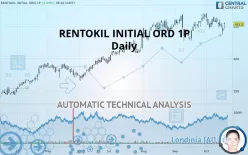
RENTOKIL INITIAL ORD 1P - Daily - Technical analysis published on 10/17/2019 (GMT)
- 284
- 0
- Who voted?
Click here for a new analysis!
- Timeframe : Daily
- - Analysis generated on
- Status : INVALID

Summary of the analysis

Additional analysis
Quotes
The RENTOKIL INITIAL ORD 1P rating is 453.2 GBX. On the day, this instrument gained +2.49% with the lowest point at 446.5 GBX and the highest point at 456.9 GBX. The deviation from the price is +1.50% for the low point and -0.81% for the high point.The Central Gaps scanner detects the formation of a bullish gap marking the strong presence of buyers against sellers at the opening. This formed a quotation gap.
Opening Gap UP
Type : Bullish
Timeframe : Openning
A study of price movements over other periods shows the following variations:
Near a new HIGH record (5 years)
Type : Bullish
Timeframe : Weekly
Near a new HIGH record (1st january)
Type : Bullish
Timeframe : Weekly
Technical
Technical analysis of RENTOKIL INITIAL ORD 1P in Daily shows an overall bullish trend. 78.57% of the signals given by moving averages are bullish. Caution: the neutral signals currently given by the short-term moving averages indicate that this bullish trend is showing signs of running out of steam. An assessment of moving averages reveals several bearish signals that could impact this trend:
Bearish price crossover with adaptative moving average 20
Type : Bearish
Timeframe : Daily
Bearish price crossover with adaptative moving average 50
Type : Bearish
Timeframe : Daily
Bearish price crossover with adaptative moving average 100
Type : Bearish
Timeframe : Daily
An assessment of technical indicators does not currently provide any relevant information on the direction of future price movements.
Caution: the Central Indicators scanner currently detects an excess:
CCI indicator is oversold : under -100
Type : Neutral
Timeframe : Daily
Williams %R indicator is oversold : under -80
Type : Neutral
Timeframe : Daily
Pivot points : price is over resistance 1
Type : Neutral
Timeframe : Daily
Parabolic SAR indicator bearish reversal
Type : Bearish
Timeframe : Daily
Price is back under the pivot point
Type : Bearish
Timeframe : Daily
The Central Patterns scanner, which studies chart patterns, resistances and supports, has identified these signals:
Support of channel is broken
Type : Bearish
Timeframe : Daily
Support of triangle is broken
Type : Bearish
Timeframe : Daily
No result was found by the Central Candlesticks scanner on Japanese candlesticks.
| S3 | S2 | S1 | Price | R1 | |
|---|---|---|---|---|---|
| ProTrendLines | 391.1 | 431.7 | 449.6 | 453.2 | 465.3 |
| Change (%) | -13.70% | -4.74% | -0.79% | - | +2.67% |
| Change | -62.1 | -21.5 | -3.6 | - | +12.1 |
| Level | Intermediate | Minor | Minor | - | Major |
Pivot points can also be used to set your price objectives. Here is the price situation in relation to pivot points:
| Pivot points | S3 | S2 | S1 | PP | R1 | R2 | R3 |
|---|---|---|---|---|---|---|---|
| Standard | 421.4 | 429.3 | 435.8 | 443.7 | 450.2 | 458.1 | 464.6 |
| Camarilla | 438.2 | 439.6 | 440.9 | 442.2 | 443.5 | 444.8 | 446.2 |
| Woodie | 420.6 | 429.0 | 435.0 | 443.4 | 449.4 | 457.8 | 463.8 |
| Fibonacci | 429.3 | 434.8 | 438.2 | 443.7 | 449.2 | 452.6 | 458.1 |
| Pivot points | S3 | S2 | S1 | PP | R1 | R2 | R3 |
|---|---|---|---|---|---|---|---|
| Standard | 429.0 | 438.5 | 446.6 | 456.1 | 464.2 | 473.7 | 481.8 |
| Camarilla | 449.9 | 451.5 | 453.1 | 454.7 | 456.3 | 457.9 | 459.5 |
| Woodie | 428.3 | 438.2 | 445.9 | 455.8 | 463.5 | 473.4 | 481.1 |
| Fibonacci | 438.5 | 445.2 | 449.4 | 456.1 | 462.8 | 467.0 | 473.7 |
| Pivot points | S3 | S2 | S1 | PP | R1 | R2 | R3 |
|---|---|---|---|---|---|---|---|
| Standard | 395.6 | 411.2 | 439.5 | 455.1 | 483.4 | 499.0 | 527.3 |
| Camarilla | 455.7 | 459.8 | 463.8 | 467.8 | 471.8 | 475.9 | 479.9 |
| Woodie | 402.0 | 414.4 | 445.9 | 458.3 | 489.8 | 502.2 | 533.7 |
| Fibonacci | 411.2 | 428.0 | 438.3 | 455.1 | 471.9 | 482.2 | 499.0 |
Numerical data
The following is the status of technical indicators and moving averages registered at the time this technical analysis was created:
| RSI (14): | 51.20 | |
| MACD (12,26,9): | 0.5000 | |
| Directional Movement: | -3.6 | |
| AROON (14): | -92.9 | |
| DEMA (21): | 454.9 | |
| Parabolic SAR (0,02-0,02-0,2): | 470.0 | |
| Elder Ray (13): | -1.6 | |
| Super Trend (3,10): | 436.9 | |
| Zig ZAG (10): | 454.4 | |
| VORTEX (21): | 1.0000 | |
| Stochastique (14,3,5): | 27.90 | |
| TEMA (21): | 451.8 | |
| Williams %R (14): | -48.30 | |
| Chande Momentum Oscillator (20): | -9.4 | |
| Repulse (5,40,3): | -1.3000 | |
| ROCnROLL: | 1 | |
| TRIX (15,9): | 0.1000 | |
| Courbe Coppock: | 2.50 |
| MA7: | 452.8 | |
| MA20: | 456.2 | |
| MA50: | 451.9 | |
| MA100: | 427.6 | |
| MAexp7: | 452.1 | |
| MAexp20: | 453.4 | |
| MAexp50: | 446.8 | |
| MAexp100: | 429.3 | |
| Price / MA7: | +0.09% | |
| Price / MA20: | -0.66% | |
| Price / MA50: | +0.29% | |
| Price / MA100: | +5.99% | |
| Price / MAexp7: | +0.24% | |
| Price / MAexp20: | -0.04% | |
| Price / MAexp50: | +1.43% | |
| Price / MAexp100: | +5.57% |
News
Don"t forget to follow the news on RENTOKIL INITIAL ORD 1P. At the time of publication of this analysis, the latest news was as follows:
-
 Rentokil Initial
-
Rentokil Initial
- Discover the Colour Psychology in Your Washroom with Rentokil Initial
-
Rentokil Initial
About author

Online


Add a comment
Comments
0 comments on the analysis RENTOKIL INITIAL ORD 1P - Daily