RELX - Daily - Technical analysis published on 04/28/2023 (GMT)
- 202
- 0
Click here for a new analysis!
- Timeframe : Daily
- - Analysis generated on
- Status : INVALID

Summary of the analysis

Additional analysis
Quotes
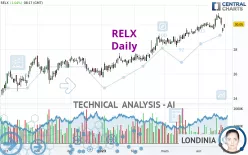
The RELX price is 30.05 EUR. The price has increased by +1.04% since the last closing with the lowest point at 29.78 EUR and the highest point at 30.08 EUR. The deviation from the price is +0.91% for the low point and -0.10% for the high point.A bullish gap was detected at the opening by the Central Gaps scanner. There are a lot of buyers and they have the upper hand in the very short term.
Opening Gap UP
Type : Bullish
Timeframe : Openning
A study of price movements over other periods shows the following variations:
New HIGH record (5 years)
Type : Bullish
Timeframe : Weekly
Near a new HIGH record (1 year)
Type : Bullish
Timeframe : Weekly
Near a new HIGH record (1st january)
Type : Bullish
Timeframe : Weekly
Near a new LOW record (1 month)
Type : Bearish
Timeframe : Weekly
Technical
A technical analysis in Daily of this RELX chart shows a strongly bullish trend. 92.86% of the signals given by moving averages are bullish. The overall trend is supported by the strong bullish signals from short-term moving averages. The Central Indicators scanner does not detect any result on moving averages that would impact this trend.
On the 18 technical indicators analysed, 6 are bullish, 9 are neutral and 3 are bearish. Other results related to technical indicators were also found by the Central Indicators scanner:
Pivot points : price is over resistance 2
Type : Neutral
Timeframe : Daily
Williams %R indicator is back over -50
Type : Bullish
Timeframe : Daily
Central Patterns, the scanner specializing in chart patterns, did not identify any signals.
Central Candlesticks, the scanner specialised in Japanese candlesticks, detects these bullish signals that could support the hypothesis of a small rebound in the very short term:
White morning star
Type : Bullish
Timeframe : Daily
Upside gap
Type : Bullish
Timeframe : Daily
| S3 | S2 | S1 | Price | R1 | |
|---|---|---|---|---|---|
| ProTrendLines | 26.89 | 28.49 | 29.36 | 30.05 | 30.32 |
| Change (%) | -10.52% | -5.19% | -2.30% | - | +0.90% |
| Change | -3.16 | -1.56 | -0.69 | - | +0.27 |
| Level | Intermediate | Major | Intermediate | - | Major |
To determine price objectives, it is also possible to use the pivot points. Here is the price position in relation to pivot points:
| Pivot points | S3 | S2 | S1 | PP | R1 | R2 | R3 |
|---|---|---|---|---|---|---|---|
| Standard | 29.12 | 29.25 | 29.49 | 29.62 | 29.86 | 29.99 | 30.23 |
| Camarilla | 29.64 | 29.67 | 29.71 | 29.74 | 29.77 | 29.81 | 29.84 |
| Woodie | 29.19 | 29.28 | 29.56 | 29.65 | 29.93 | 30.02 | 30.30 |
| Fibonacci | 29.25 | 29.39 | 29.48 | 29.62 | 29.76 | 29.85 | 29.99 |
| Pivot points | S3 | S2 | S1 | PP | R1 | R2 | R3 |
|---|---|---|---|---|---|---|---|
| Standard | 28.35 | 28.78 | 29.55 | 29.98 | 30.75 | 31.18 | 31.95 |
| Camarilla | 29.99 | 30.10 | 30.21 | 30.32 | 30.43 | 30.54 | 30.65 |
| Woodie | 28.52 | 28.87 | 29.72 | 30.07 | 30.92 | 31.27 | 32.12 |
| Fibonacci | 28.78 | 29.24 | 29.52 | 29.98 | 30.44 | 30.72 | 31.18 |
| Pivot points | S3 | S2 | S1 | PP | R1 | R2 | R3 |
|---|---|---|---|---|---|---|---|
| Standard | 26.51 | 27.14 | 28.24 | 28.87 | 29.97 | 30.60 | 31.70 |
| Camarilla | 28.87 | 29.03 | 29.19 | 29.35 | 29.51 | 29.67 | 29.83 |
| Woodie | 26.76 | 27.26 | 28.49 | 28.99 | 30.22 | 30.72 | 31.95 |
| Fibonacci | 27.14 | 27.80 | 28.21 | 28.87 | 29.53 | 29.94 | 30.60 |
Numerical data
The following are the details of the technical indicators and moving averages that were collected to generate this technical analysis:
| RSI (14): | 62.35 | |
| MACD (12,26,9): | 0.3500 | |
| Directional Movement: | 10.97 | |
| AROON (14): | 21.43 | |
| DEMA (21): | 30.09 | |
| Parabolic SAR (0,02-0,02-0,2): | 30.48 | |
| Elder Ray (13): | 0.15 | |
| Super Trend (3,10): | 29.19 | |
| Zig ZAG (10): | 30.05 | |
| VORTEX (21): | 1.1000 | |
| Stochastique (14,3,5): | 47.39 | |
| TEMA (21): | 30.08 | |
| Williams %R (14): | -34.41 | |
| Chande Momentum Oscillator (20): | 0.41 | |
| Repulse (5,40,3): | 1.9500 | |
| ROCnROLL: | 1 | |
| TRIX (15,9): | 0.1800 | |
| Courbe Coppock: | 3.83 |
| MA7: | 30.04 | |
| MA20: | 29.64 | |
| MA50: | 28.87 | |
| MA100: | 27.67 | |
| MAexp7: | 29.91 | |
| MAexp20: | 29.61 | |
| MAexp50: | 28.89 | |
| MAexp100: | 28.07 | |
| Price / MA7: | +0.03% | |
| Price / MA20: | +1.38% | |
| Price / MA50: | +4.09% | |
| Price / MA100: | +8.60% | |
| Price / MAexp7: | +0.47% | |
| Price / MAexp20: | +1.49% | |
| Price / MAexp50: | +4.02% | |
| Price / MAexp100: | +7.05% |
About author
Online


Add a comment
Comments
0 comments on the analysis RELX - Daily