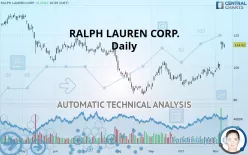
RALPH LAUREN CORP. - Daily - Technical analysis published on 11/12/2019 (GMT)
- 308
- 0
- Who voted?
Click here for a new analysis!
- Timeframe : Daily
- - Analysis generated on
- Status : INVALID

Summary of the analysis

Additional analysis
Quotes
RALPH LAUREN CORP. rating 114.01 USD. The price registered an increase of +0.21% on the session with the lowest point at 111.85 USD and the highest point at 114.66 USD. The deviation from the price is +1.93% for the low point and -0.57% for the high point.The Central Gaps scanner detects a bearish opening marking the presence of sellers ahead of buyers at the opening but not sufficiently marked to allow the price to register a quotation gap.
Bearish opening
Type : Bearish
Timeframe : Openning
Here is a more detailed summary of the historical variations registered by RALPH LAUREN CORP.:
Near a new HIGH record (1 month)
Type : Bullish
Timeframe : Weekly
The Central Volumes scanner detects abnormal volumes on the asset:
Abnormal volumes
Timeframe : 5 days
Technical
A technical analysis in Daily of this RALPH LAUREN CORP. chart shows a strongly bullish trend. 85.71% of the signals given by moving averages are bullish. This strongly bullish trend is supported by the strong bullish signals given by short-term moving averages. There is no crossing of moving average by the price or crossing of moving averages between themselves.
The probability of a further increase is high given the direction of the technical indicators.
But beware of excesses. The Central Indicators scanner currently detects this:
RSI indicator is overbought : over 70
Type : Neutral
Timeframe : Daily
CCI indicator is overbought : over 100
Type : Neutral
Timeframe : Daily
Previous candle closed over Bollinger bands
Type : Neutral
Timeframe : Daily
Williams %R indicator is overbought : over -20
Type : Neutral
Timeframe : Daily
Price is back over the pivot point
Type : Bullish
Timeframe : Weekly
An analysis of the price chart with the Central Patterns scanner (detector of chart patterns and resistances and supports) shows a result that can have an impact on the price change:
Resistance of channel is broken
Type : Bullish
Timeframe : Daily
No result was found by the Central Candlesticks scanner on Japanese candlesticks.
| S3 | S2 | S1 | Price | R1 | R2 | R3 | |
|---|---|---|---|---|---|---|---|
| ProTrendLines | 96.30 | 102.49 | 113.68 | 114.01 | 120.29 | 127.04 | 132.09 |
| Change (%) | -15.53% | -10.10% | -0.29% | - | +5.51% | +11.43% | +15.86% |
| Change | -17.71 | -11.52 | -0.33 | - | +6.28 | +13.03 | +18.08 |
| Level | Major | Major | Major | - | Intermediate | Minor | Intermediate |
To determine price objectives, it is also possible to use the pivot points. Here is the price position in relation to pivot points:
| Pivot points | S3 | S2 | S1 | PP | R1 | R2 | R3 |
|---|---|---|---|---|---|---|---|
| Standard | 107.31 | 109.44 | 111.60 | 113.73 | 115.89 | 118.02 | 120.18 |
| Camarilla | 112.59 | 112.98 | 113.38 | 113.77 | 114.16 | 114.56 | 114.95 |
| Woodie | 107.34 | 109.45 | 111.63 | 113.74 | 115.92 | 118.03 | 120.21 |
| Fibonacci | 109.44 | 111.08 | 112.09 | 113.73 | 115.37 | 116.38 | 118.02 |
| Pivot points | S3 | S2 | S1 | PP | R1 | R2 | R3 |
|---|---|---|---|---|---|---|---|
| Standard | 85.22 | 91.87 | 102.82 | 109.47 | 120.42 | 127.07 | 138.02 |
| Camarilla | 108.93 | 110.54 | 112.16 | 113.77 | 115.38 | 117.00 | 118.61 |
| Woodie | 87.37 | 92.95 | 104.97 | 110.55 | 122.57 | 128.15 | 140.17 |
| Fibonacci | 91.87 | 98.59 | 102.75 | 109.47 | 116.19 | 120.35 | 127.07 |
| Pivot points | S3 | S2 | S1 | PP | R1 | R2 | R3 |
|---|---|---|---|---|---|---|---|
| Standard | 76.86 | 82.44 | 89.25 | 94.83 | 101.64 | 107.22 | 114.03 |
| Camarilla | 92.65 | 93.79 | 94.92 | 96.06 | 97.20 | 98.33 | 99.47 |
| Woodie | 77.48 | 82.75 | 89.87 | 95.14 | 102.26 | 107.53 | 114.65 |
| Fibonacci | 82.44 | 87.17 | 90.10 | 94.83 | 99.56 | 102.49 | 107.22 |
Numerical data
The following is the status of the technical indicators and moving averages at the time of publication of this technical analysis:
| RSI (14): | 75.24 | |
| MACD (12,26,9): | 4.3700 | |
| Directional Movement: | 32.89 | |
| AROON (14): | 35.71 | |
| DEMA (21): | 106.39 | |
| Parabolic SAR (0,02-0,02-0,2): | 96.12 | |
| Elder Ray (13): | 9.21 | |
| Super Trend (3,10): | 101.50 | |
| Zig ZAG (10): | 114.01 | |
| VORTEX (21): | 1.1000 | |
| Stochastique (14,3,5): | 92.58 | |
| TEMA (21): | 109.90 | |
| Williams %R (14): | -9.56 | |
| Chande Momentum Oscillator (20): | 16.89 | |
| Repulse (5,40,3): | 2.9300 | |
| ROCnROLL: | 1 | |
| TRIX (15,9): | 0.3600 | |
| Courbe Coppock: | 22.37 |
| MA7: | 106.20 | |
| MA20: | 99.78 | |
| MA50: | 96.24 | |
| MA100: | 98.76 | |
| MAexp7: | 107.94 | |
| MAexp20: | 101.52 | |
| MAexp50: | 98.21 | |
| MAexp100: | 100.08 | |
| Price / MA7: | +7.35% | |
| Price / MA20: | +14.26% | |
| Price / MA50: | +18.46% | |
| Price / MA100: | +15.44% | |
| Price / MAexp7: | +5.62% | |
| Price / MAexp20: | +12.30% | |
| Price / MAexp50: | +16.09% | |
| Price / MAexp100: | +13.92% |
News
The last news published on RALPH LAUREN CORP. at the time of the generation of this analysis was as follows:
- Ralph Lauren Corporation Declares Quarterly Dividend
-
 Ralph Lauren's New ‘Earth Polo’ Is Made From Recycled Materials
- New Research Coverage Highlights Ralph Lauren, CECO Environmental, PRA Group, ChemoCentryx, SunCoke Energy Partners, and Delek US — Consolidated Revenues, Company Growth, and Expectations for 2018
- Ralph Lauren Corporation Class A to Host Earnings Call
-
Jim Cramer: Maybe Ralph Lauren's New CEO Can Help With Line Extensions
About author

Online


Add a comment
Comments
0 comments on the analysis RALPH LAUREN CORP. - Daily