LUMIBIRD - 1H - Technical analysis published on 03/18/2024 (GMT)
- 175
- 0
Click here for a new analysis!
- Timeframe : 1H
- - Analysis generated on
- Status : TARGET REACHED
Summary of the analysis

Additional analysis
Quotes
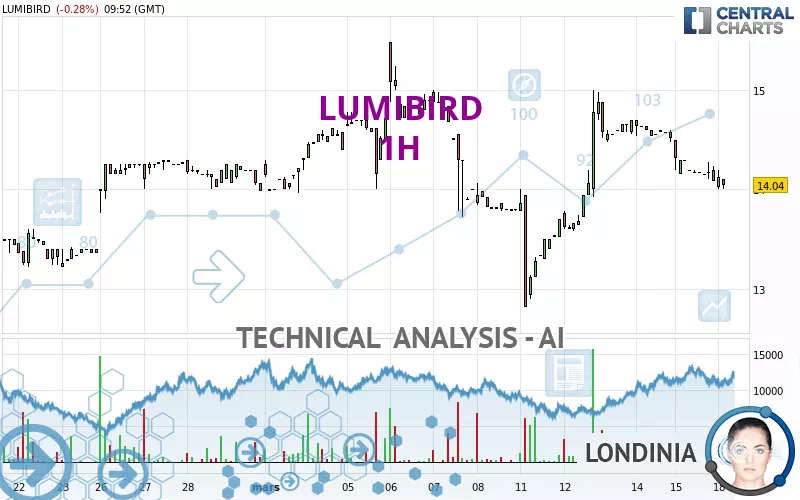
The LUMIBIRD price is 14.04 EUR. The price is lower by -0.28% since the last closing with the lowest point at 14.00 EUR and the highest point at 14.20 EUR. The deviation from the price is +0.29% for the low point and -1.13% for the high point.The Central Gaps scanner detects the formation of a bearish gap marking the strong presence of sellers ahead of buyers at the opening. This formed a quotation gap.
Opening Gap DOWN
Type : Bearish
Timeframe : Openning
A study of price movements over other periods shows the following variations:
Abnormal volumes
Timeframe : 20 days
Abnormal volumes
Timeframe : 50 days
Technical
Technical analysis of LUMIBIRD in 1H shows an overall bearish trend. The signals given by moving averages are 67.86% bearish. This bearish trend is reinforced by the strong signals currently being given by short-term moving averages. The Central Indicators market scanner is currently detecting several bearish signals that could impact this trend:
Moving Average bearish crossovers : AMA20 & AMA50
Type : Bearish
Timeframe : 1 hour
Bearish price crossover with Moving Average 50
Type : Bearish
Timeframe : 1 hour
Technical indicators are bearish. There is still some doubt about the decline in the price.
But beware of excesses. The Central Indicators scanner currently detects this:
CCI indicator is oversold : under -100
Type : Neutral
Timeframe : 1 hour
Williams %R indicator is oversold : under -80
Type : Neutral
Timeframe : 1 hour
Ichimoku : price is under the cloud
Type : Bearish
Timeframe : 1 hour
The Central Patterns scanner, which studies chart patterns, resistances and supports, has identified this signal:
Near resistance of channel
Type : Bearish
Timeframe : 1 hour
For a small setback in the very short term, the Central Candlesticks scanner currently notes the presence of this bearish pattern in Japanese candlesticks:
Bearish harami
Type : Bearish
Timeframe : 1 hour
| S3 | S2 | S1 | Price | R1 | R2 | R3 | |
|---|---|---|---|---|---|---|---|
| ProTrendLines | 12.82 | 13.30 | 13.99 | 14.04 | 14.47 | 14.89 | 15.38 |
| Change (%) | -8.69% | -5.27% | -0.36% | - | +3.06% | +6.05% | +9.54% |
| Change | -1.22 | -0.74 | -0.05 | - | +0.43 | +0.85 | +1.34 |
| Level | Minor | Major | Intermediate | - | Major | Major | Major |
Attention could also be paid to pivot points to set price objectives:
| Pivot points | S3 | S2 | S1 | PP | R1 | R2 | R3 |
|---|---|---|---|---|---|---|---|
| Standard | 13.52 | 13.80 | 13.94 | 14.22 | 14.36 | 14.64 | 14.78 |
| Camarilla | 13.97 | 14.00 | 14.04 | 14.08 | 14.12 | 14.16 | 14.20 |
| Woodie | 13.45 | 13.77 | 13.87 | 14.19 | 14.29 | 14.61 | 14.71 |
| Fibonacci | 13.80 | 13.96 | 14.06 | 14.22 | 14.38 | 14.48 | 14.64 |
| Pivot points | S3 | S2 | S1 | PP | R1 | R2 | R3 |
|---|---|---|---|---|---|---|---|
| Standard | 10.75 | 11.79 | 12.93 | 13.97 | 15.11 | 16.15 | 17.29 |
| Camarilla | 13.48 | 13.68 | 13.88 | 14.08 | 14.28 | 14.48 | 14.68 |
| Woodie | 10.81 | 11.82 | 12.99 | 14.00 | 15.17 | 16.18 | 17.35 |
| Fibonacci | 11.79 | 12.62 | 13.13 | 13.97 | 14.80 | 15.31 | 16.15 |
| Pivot points | S3 | S2 | S1 | PP | R1 | R2 | R3 |
|---|---|---|---|---|---|---|---|
| Standard | 9.25 | 10.33 | 12.15 | 13.23 | 15.05 | 16.13 | 17.95 |
| Camarilla | 13.18 | 13.45 | 13.71 | 13.98 | 14.25 | 14.51 | 14.78 |
| Woodie | 9.63 | 10.52 | 12.53 | 13.42 | 15.43 | 16.32 | 18.33 |
| Fibonacci | 10.33 | 11.43 | 12.12 | 13.23 | 14.33 | 15.02 | 16.13 |
Numerical data
The following are the details of the technical indicators and moving averages that were collected to generate this technical analysis:
| RSI (14): | 35.49 | |
| MACD (12,26,9): | -0.0600 | |
| Directional Movement: | -8.41 | |
| AROON (14): | -85.72 | |
| DEMA (21): | 14.22 | |
| Parabolic SAR (0,02-0,02-0,2): | 14.64 | |
| Elder Ray (13): | -0.16 | |
| Super Trend (3,10): | 14.40 | |
| Zig ZAG (10): | 14.00 | |
| VORTEX (21): | 0.7000 | |
| Stochastique (14,3,5): | 6.67 | |
| TEMA (21): | 14.11 | |
| Williams %R (14): | -100.00 | |
| Chande Momentum Oscillator (20): | -0.58 | |
| Repulse (5,40,3): | -1.1300 | |
| ROCnROLL: | 2 | |
| TRIX (15,9): | 0.0200 | |
| Courbe Coppock: | 6.39 |
| MA7: | 14.12 | |
| MA20: | 14.03 | |
| MA50: | 12.56 | |
| MA100: | 12.68 | |
| MAexp7: | 14.13 | |
| MAexp20: | 14.25 | |
| MAexp50: | 14.24 | |
| MAexp100: | 14.12 | |
| Price / MA7: | -0.57% | |
| Price / MA20: | +0.07% | |
| Price / MA50: | +11.78% | |
| Price / MA100: | +10.73% | |
| Price / MAexp7: | -0.64% | |
| Price / MAexp20: | -1.47% | |
| Price / MAexp50: | -1.40% | |
| Price / MAexp100: | -0.57% |
News
Don't forget to follow the news on LUMIBIRD. At the time of publication of this analysis, the latest news was as follows:
- LUMIBIRD: FINANCIAL COMMUNICATIONS AGENDA
- LUMIBIRD: MAJOR CONTRACT SIGNED FOR LASER RANGEFINDERS FOR DEFENCE APPLICATIONS
- LUMIBIRD COMPLETES ACQUISITION OF PRIMA INDUSTRIE'S HIGH POWER LASER AND SEMICONDUCTOR BUSINESSES IN ITALY AND THE UNITED STATES
- LUMIBIRD : 2023 – HALF YEAR REVENUES OF €97.2M (+16%)
- Lumibird announces agreement to acquire Prima Industrie's high power laser and semiconductor businesses
About author
Online


Add a comment
Comments
0 comments on the analysis LUMIBIRD - 1H