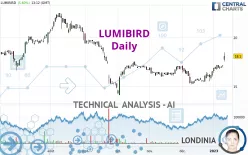
LUMIBIRD - Daily - Technical analysis published on 01/11/2023 (GMT)
- 205
- 0
Click here for a new analysis!
- Timeframe : Daily
- - Analysis generated on
- Status : LEVEL MAINTAINED

Summary of the analysis

Additional analysis
Quotes
The LUMIBIRD price is 18.10 EUR. The price registered an increase of +5.60% on the session and was between 17.58 EUR and 18.48 EUR. This implies that the price is at +2.96% from its lowest and at -2.06% from its highest.A bullish gap was detected at the opening by the Central Gaps scanner. There are a lot of buyers and they have the upper hand in the very short term.
Opening Gap UP
Type : Bullish
Timeframe : Openning
Here is a more detailed summary of the historical variations registered by LUMIBIRD:
New HIGH record (1st january)
Type : Bullish
Timeframe : Weekly
New HIGH record (1 month)
Type : Bullish
Timeframe : Weekly
Technical
Technical analysis of this Daily chart of LUMIBIRD indicates that the overall trend is bullish. The signals returned by the moving averages are 67.86% bullish. This bullish trend is reinforced by the strong signals currently being given by short-term moving averages. The Central Indicators scanner detects bullish signals on moving averages that could impact this trend:
Bullish trend reversal : adaptative moving average 100
Type : Bullish
Timeframe : Daily
Moving Average bullish crossovers : MA20 & MA50
Type : Bullish
Timeframe : Daily
Moving Average bullish crossovers : AMA20 & AMA50
Type : Bullish
Timeframe : Daily
Technical indicators are strongly bullish, suggesting that the price increase should continue.
But beware of excesses. The Central Indicators scanner currently detects this:
RSI indicator is overbought : over 70
Type : Neutral
Timeframe : Daily
CCI indicator is overbought : over 100
Type : Neutral
Timeframe : Daily
Williams %R indicator is overbought : over -20
Type : Neutral
Timeframe : Daily
Pivot points : price is over resistance 3
Type : Neutral
Timeframe : Daily
Pivot points : price is over resistance 3
Type : Neutral
Timeframe : Weekly
An analysis of the price chart with the Central Patterns scanner (detector of chart patterns and resistances and supports) shows a result that can have an impact on the price change:
Horizontal resistance is broken
Type : Bullish
Timeframe : Daily
No result was found by the Central Candlesticks scanner on Japanese candlesticks.
| S3 | S2 | S1 | Price | R1 | R2 | R3 | |
|---|---|---|---|---|---|---|---|
| ProTrendLines | 16.01 | 17.20 | 18.08 | 18.10 | 21.43 | 22.50 | 24.20 |
| Change (%) | -11.55% | -4.97% | -0.11% | - | +18.40% | +24.31% | +33.70% |
| Change | -2.09 | -0.90 | -0.02 | - | +3.33 | +4.40 | +6.10 |
| Level | Minor | Intermediate | Major | - | Minor | Major | Major |
To determine price objectives, it is also possible to use the pivot points. Here is the price position in relation to pivot points:
| Pivot points | S3 | S2 | S1 | PP | R1 | R2 | R3 |
|---|---|---|---|---|---|---|---|
| Standard | 16.76 | 16.86 | 17.00 | 17.10 | 17.24 | 17.34 | 17.48 |
| Camarilla | 17.07 | 17.10 | 17.12 | 17.14 | 17.16 | 17.18 | 17.21 |
| Woodie | 16.78 | 16.87 | 17.02 | 17.11 | 17.26 | 17.35 | 17.50 |
| Fibonacci | 16.86 | 16.95 | 17.01 | 17.10 | 17.19 | 17.25 | 17.34 |
| Pivot points | S3 | S2 | S1 | PP | R1 | R2 | R3 |
|---|---|---|---|---|---|---|---|
| Standard | 15.65 | 16.03 | 16.43 | 16.81 | 17.21 | 17.59 | 17.99 |
| Camarilla | 16.63 | 16.70 | 16.77 | 16.84 | 16.91 | 16.98 | 17.06 |
| Woodie | 15.67 | 16.04 | 16.45 | 16.82 | 17.23 | 17.60 | 18.01 |
| Fibonacci | 16.03 | 16.33 | 16.51 | 16.81 | 17.11 | 17.29 | 17.59 |
| Pivot points | S3 | S2 | S1 | PP | R1 | R2 | R3 |
|---|---|---|---|---|---|---|---|
| Standard | 13.61 | 14.43 | 15.49 | 16.31 | 17.37 | 18.19 | 19.25 |
| Camarilla | 16.04 | 16.22 | 16.39 | 16.56 | 16.73 | 16.91 | 17.08 |
| Woodie | 13.74 | 14.49 | 15.62 | 16.37 | 17.50 | 18.25 | 19.38 |
| Fibonacci | 14.43 | 15.15 | 15.59 | 16.31 | 17.03 | 17.47 | 18.19 |
Numerical data
The following are the details of the technical indicators and moving averages that were collected to generate this technical analysis:
| RSI (14): | 73.09 | |
| MACD (12,26,9): | 0.3300 | |
| Directional Movement: | 28.86 | |
| AROON (14): | 100.00 | |
| DEMA (21): | 17.02 | |
| Parabolic SAR (0,02-0,02-0,2): | 16.45 | |
| Elder Ray (13): | 1.15 | |
| Super Trend (3,10): | 16.65 | |
| Zig ZAG (10): | 18.10 | |
| VORTEX (21): | 1.1800 | |
| Stochastique (14,3,5): | 91.93 | |
| TEMA (21): | 17.39 | |
| Williams %R (14): | -12.75 | |
| Chande Momentum Oscillator (20): | 1.86 | |
| Repulse (5,40,3): | 2.3600 | |
| ROCnROLL: | 1 | |
| TRIX (15,9): | 0.1300 | |
| Courbe Coppock: | 17.74 |
| MA7: | 17.15 | |
| MA20: | 16.41 | |
| MA50: | 16.35 | |
| MA100: | 17.08 | |
| MAexp7: | 17.20 | |
| MAexp20: | 16.68 | |
| MAexp50: | 16.61 | |
| MAexp100: | 17.15 | |
| Price / MA7: | +5.54% | |
| Price / MA20: | +10.30% | |
| Price / MA50: | +10.70% | |
| Price / MA100: | +5.97% | |
| Price / MAexp7: | +5.23% | |
| Price / MAexp20: | +8.51% | |
| Price / MAexp50: | +8.97% | |
| Price / MAexp100: | +5.54% |
News
Don't forget to follow the news on LUMIBIRD. At the time of publication of this analysis, the latest news was as follows:
- Lumibird: NINE-MONTH REVENUES OF €125M (+11%)
- LUMIBIRD ACQUIRES INNOPTICS, SPECIALIZED IN OPTOELECTRONIC COMPONENT PACKAGING
- LUMIBIRD: 2022 HALF-YEAR EARNINGS IMPACTED BY STRUCTURING INVESTMENTS
- Lumibird: 2022 FIRST-HALF REVENUES OF €84M (+11%)
- LUMIBIRD MEDICAL STRENGTHENS ITS PRESENCE IN INDIA WITH THE CREATION OF A NEW SUBSIDIARY
About author
Online


Add a comment
Comments
0 comments on the analysis LUMIBIRD - Daily