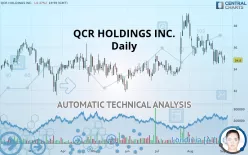
QCR HOLDINGS INC. - Daily - Technical analysis published on 09/05/2019 (GMT)
- 153
- 0
- Who voted?
Click here for a new analysis!
- Timeframe : Daily
- - Analysis generated on
- Status : INVALID

Summary of the analysis

Additional analysis
Quotes
The QCR HOLDINGS INC. rating is 34.80 USD. The price registered a decrease of -0.37% on the session and was between 34.56 USD and 35.27 USD. This implies that the price is at +0.69% from its lowest and at -1.33% from its highest.The Central Gaps scanner detects a bullish opening. A small advantage for buyers in the very short term.
Bullish opening
Type : Bullish
Timeframe : Openning
A study of price movements over other periods shows the following variations:
Near a new LOW record (1 month)
Type : Bearish
Timeframe : Weekly
Technical
Technical analysis of QCR HOLDINGS INC. in Daily shows a neutral overall trend. The strong bearish signals currently being given by short-term moving averages could allow the overall trend to return to a bearish trend. The Central Indicators market scanner is currently detecting a bearish signal that could impact this trend:
Bearish trend reversal : adaptative moving average 100
Type : Bearish
Timeframe : Daily
An assessment of technical indicators does not currently provide any relevant information on the direction of future price movements.
Caution: the Central Indicators scanner currently detects an excess:
CCI indicator is oversold : under -100
Type : Neutral
Timeframe : Daily
Williams %R indicator is oversold : under -80
Type : Neutral
Timeframe : Daily
Williams %R indicator is overbought : over -20
Type : Neutral
Timeframe : Daily
Price is back over the pivot point
Type : Bullish
Timeframe : Weekly
No signals are given by Central Patterns, a market scanner specialised in chart patterns, resistances and supports.
No result was found by the Central Candlesticks scanner on Japanese candlesticks.
| S3 | S2 | S1 | Price | R1 | R2 | R3 | |
|---|---|---|---|---|---|---|---|
| ProTrendLines | 30.39 | 32.35 | 33.68 | 34.80 | 35.28 | 36.35 | 37.26 |
| Change (%) | -12.67% | -7.04% | -3.22% | - | +1.38% | +4.45% | +7.07% |
| Change | -4.41 | -2.45 | -1.12 | - | +0.48 | +1.55 | +2.46 |
| Level | Major | Minor | Intermediate | - | Major | Intermediate | Intermediate |
Pivot points can also be used to set your price objectives. Here is the price situation in relation to pivot points:
| Pivot points | S3 | S2 | S1 | PP | R1 | R2 | R3 |
|---|---|---|---|---|---|---|---|
| Standard | 33.87 | 34.19 | 34.56 | 34.88 | 35.25 | 35.57 | 35.94 |
| Camarilla | 34.74 | 34.80 | 34.87 | 34.93 | 34.99 | 35.06 | 35.12 |
| Woodie | 33.90 | 34.20 | 34.59 | 34.89 | 35.28 | 35.58 | 35.97 |
| Fibonacci | 34.19 | 34.45 | 34.62 | 34.88 | 35.14 | 35.31 | 35.57 |
| Pivot points | S3 | S2 | S1 | PP | R1 | R2 | R3 |
|---|---|---|---|---|---|---|---|
| Standard | 33.21 | 33.81 | 34.56 | 35.17 | 35.92 | 36.52 | 37.27 |
| Camarilla | 34.94 | 35.06 | 35.19 | 35.31 | 35.43 | 35.56 | 35.68 |
| Woodie | 33.28 | 33.85 | 34.63 | 35.20 | 35.99 | 36.56 | 37.34 |
| Fibonacci | 33.81 | 34.33 | 34.65 | 35.17 | 35.68 | 36.00 | 36.52 |
| Pivot points | S3 | S2 | S1 | PP | R1 | R2 | R3 |
|---|---|---|---|---|---|---|---|
| Standard | 29.47 | 31.92 | 33.62 | 36.07 | 37.77 | 40.22 | 41.92 |
| Camarilla | 34.17 | 34.55 | 34.93 | 35.31 | 35.69 | 36.07 | 36.45 |
| Woodie | 29.09 | 31.73 | 33.24 | 35.88 | 37.39 | 40.03 | 41.54 |
| Fibonacci | 31.92 | 33.51 | 34.49 | 36.07 | 37.66 | 38.64 | 40.22 |
Numerical data
The following is the status of the technical indicators and moving averages at the time of publication of this technical analysis:
| RSI (14): | 43.96 | |
| MACD (12,26,9): | -0.2100 | |
| Directional Movement: | -7.87 | |
| AROON (14): | -28.57 | |
| DEMA (21): | 35.38 | |
| Parabolic SAR (0,02-0,02-0,2): | 37.26 | |
| Elder Ray (13): | -0.49 | |
| Super Trend (3,10): | 37.51 | |
| Zig ZAG (10): | 34.80 | |
| VORTEX (21): | 0.9300 | |
| Stochastique (14,3,5): | 22.46 | |
| TEMA (21): | 34.93 | |
| Williams %R (14): | -85.11 | |
| Chande Momentum Oscillator (20): | -1.84 | |
| Repulse (5,40,3): | -1.3400 | |
| ROCnROLL: | 2 | |
| TRIX (15,9): | -0.0100 | |
| Courbe Coppock: | 6.42 |
| MA7: | 35.13 | |
| MA20: | 35.77 | |
| MA50: | 35.40 | |
| MA100: | 34.68 | |
| MAexp7: | 35.15 | |
| MAexp20: | 35.55 | |
| MAexp50: | 35.38 | |
| MAexp100: | 35.10 | |
| Price / MA7: | -0.94% | |
| Price / MA20: | -2.71% | |
| Price / MA50: | -1.69% | |
| Price / MA100: | +0.35% | |
| Price / MAexp7: | -1.00% | |
| Price / MAexp20: | -2.11% | |
| Price / MAexp50: | -1.64% | |
| Price / MAexp100: | -0.85% |
News
The latest news and videos published on QCR HOLDINGS INC. at the time of the analysis were as follows:
-
 QCR
QCR
- QCR Holdings, Inc. Announces Record Net Income of $8.5 Million for the Fourth Quarter of 2016 and Record Net Income of $27.7 Million for the Year
- QCR Holdings, Inc. Announces a Cash Dividend
-
QCR
- QCR Holdings, Inc. Announces Third Quarter Earnings and Successful Closing of Des Moines Acquisition
About author

Online


Add a comment
Comments
0 comments on the analysis QCR HOLDINGS INC. - Daily