| Open: | - |
| Change: | - |
| Volume: | - |
| Low: | - |
| High: | - |
| High / Low range: | - |
| Type: | Stocks |
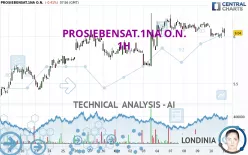
| Ticker: | PSM |
| ISIN: | DE000PSM7770 |
PROSIEBENSAT.1NA O.N. - 1H - Technical analysis published on 10/11/2024 (GMT)
- 130
- 0
- 10/11/2024 - 08:20
- Timeframe : 1H
- - Analysis generated on 10/11/2024 - 08:20
- Status : NEUTRAL

Summary of the analysis

Additional analysis
Quotes
PROSIEBENSAT.1NA O.N. rating 6.040 EUR. The price is lower by -0.41% since the last closing and was between 6.005 EUR and 6.085 EUR. This implies that the price is at +0.58% from its lowest and at -0.74% from its highest.The Central Gaps scanner detects a bullish opening. A small advantage for buyers in the very short term.
Bullish opening
Type : Bullish
Timeframe : Openning
So that you have an overall view of the price change, here is a table showing the variations over several periods:
Near a new HIGH record (1 month)
Type : Bullish
Timeframe : Weekly
Technical
Technical analysis of PROSIEBENSAT.1NA O.N. in 1H shows an overall slightly bullish trend. Only 57.14% of the signals given by moving averages are bullish. This slightly bullish trend could turn neutral or reverse given the slightly bearish signals currently being given by short-term moving averages. An assessment of moving averages reveals a bearish signal that could impact this trend:
Bearish price crossover with adaptative moving average 20
Type : Bearish
Timeframe : 1 hour
An assessment of technical indicators does not currently provide any relevant information to suggest whether the signal given by the technical indicators is more bullish or bearish.
But beware of excesses. The Central Indicators scanner currently detects this:
Williams %R indicator is oversold : under -80
Type : Neutral
Timeframe : 1 hour
RSI indicator is back under 50
Type : Bearish
Timeframe : 1 hour
Price is back under the pivot point
Type : Bearish
Timeframe : 1 hour
An analysis of the price chart with the Central Patterns scanner (detector of chart patterns and resistances and supports) shows a result that can have an impact on the price change:
Near support of channel
Type : Bullish
Timeframe : 1 hour
Central Candlesticks, the scanner specialised in Japanese candlesticks, detects a bearish signal that could support the hypothesis of a small drop in the very short term:
Bearish engulfing lines
Type : Bearish
Timeframe : 1 hour
| S3 | S2 | S1 | Price | R1 | R2 | R3 | |
|---|---|---|---|---|---|---|---|
| ProTrendLines | 5.460 | 5.685 | 5.950 | 6.040 | 6.048 | 6.156 | 6.250 |
| Change (%) | -9.60% | -5.88% | -1.49% | - | +0.13% | +1.92% | +3.48% |
| Change | -0.580 | -0.355 | -0.090 | - | +0.008 | +0.116 | +0.210 |
| Level | Intermediate | Intermediate | Major | - | Major | Intermediate | Minor |
Attention could also be paid to pivot points to set price objectives:
| Pivot points | S3 | S2 | S1 | PP | R1 | R2 | R3 |
|---|---|---|---|---|---|---|---|
| Standard | 5.892 | 5.938 | 6.002 | 6.048 | 6.112 | 6.158 | 6.222 |
| Camarilla | 6.035 | 6.045 | 6.055 | 6.065 | 6.075 | 6.085 | 6.095 |
| Woodie | 5.900 | 5.943 | 6.010 | 6.053 | 6.120 | 6.163 | 6.230 |
| Fibonacci | 5.938 | 5.980 | 6.006 | 6.048 | 6.090 | 6.116 | 6.158 |
| Pivot points | S3 | S2 | S1 | PP | R1 | R2 | R3 |
|---|---|---|---|---|---|---|---|
| Standard | 5.245 | 5.465 | 5.810 | 6.030 | 6.375 | 6.595 | 6.940 |
| Camarilla | 6.000 | 6.051 | 6.103 | 6.155 | 6.207 | 6.259 | 6.310 |
| Woodie | 5.308 | 5.496 | 5.873 | 6.061 | 6.438 | 6.626 | 7.003 |
| Fibonacci | 5.465 | 5.681 | 5.814 | 6.030 | 6.246 | 6.379 | 6.595 |
| Pivot points | S3 | S2 | S1 | PP | R1 | R2 | R3 |
|---|---|---|---|---|---|---|---|
| Standard | 4.445 | 4.810 | 5.315 | 5.680 | 6.185 | 6.550 | 7.055 |
| Camarilla | 5.581 | 5.661 | 5.740 | 5.820 | 5.900 | 5.980 | 6.059 |
| Woodie | 4.515 | 4.845 | 5.385 | 5.715 | 6.255 | 6.585 | 7.125 |
| Fibonacci | 4.810 | 5.142 | 5.348 | 5.680 | 6.012 | 6.218 | 6.550 |
Numerical data
The following is the status of technical indicators and moving averages registered at the time this technical analysis was created:
| RSI (14): | 45.44 | |
| MACD (12,26,9): | -0.0130 | |
| Directional Movement: | -1.804 | |
| AROON (14): | -71.428 | |
| DEMA (21): | 6.039 | |
| Parabolic SAR (0,02-0,02-0,2): | 6.215 | |
| Elder Ray (13): | -0.003 | |
| Super Trend (3,10): | 6.003 | |
| Zig ZAG (10): | 6.015 | |
| VORTEX (21): | 0.8430 | |
| Stochastique (14,3,5): | 34.31 | |
| TEMA (21): | 6.018 | |
| Williams %R (14): | -67.65 | |
| Chande Momentum Oscillator (20): | -0.095 | |
| Repulse (5,40,3): | -0.1880 | |
| ROCnROLL: | -1 | |
| TRIX (15,9): | -0.0210 | |
| Courbe Coppock: | 2.53 |
| MA7: | 6.051 | |
| MA20: | 5.807 | |
| MA50: | 5.765 | |
| MA100: | 6.319 | |
| MAexp7: | 6.040 | |
| MAexp20: | 6.056 | |
| MAexp50: | 6.038 | |
| MAexp100: | 5.957 | |
| Price / MA7: | -0.18% | |
| Price / MA20: | +4.01% | |
| Price / MA50: | +4.77% | |
| Price / MA100: | -4.42% | |
| Price / MAexp7: | -0% | |
| Price / MAexp20: | -0.26% | |
| Price / MAexp50: | +0.03% | |
| Price / MAexp100: | +1.39% |
News
Don't forget to follow the news on PROSIEBENSAT.1NA O.N.. At the time of publication of this analysis, the latest news was as follows:
- 04/15/2024 - 17:53 EQS-Adhoc: ProSiebenSat.1 has a very good start to 2024 as expected and confirms full-year outlook
- 02/13/2024 - 18:11 EQS-Adhoc: ProSiebenSat.1 records a higher than expected increase in earnings in the fourth quarter of 2023 and specifies its outlook for 2024
- 12/19/2023 - 19:10 EQS-Adhoc: ProSiebenSat.1 increases investments in local content and at the same time expects stable earnings next year – impairment on programming assets in 2023
- 04/27/2023 - 18:28 EQS-Adhoc: ProSiebenSat.1 Media SE adjusts dividend policy, proposes significantly reduced dividend for fiscal year 2022 and announces change in the Executive Board
- 02/28/2023 - 17:35 EQS-Adhoc: ProSiebenSat.1 Media SE postpones presentation of Annual and Consolidated Financial Statements and possibly also Annual General Meeting
About author
Online


Add a comment
Comments
0 comments on the analysis PROSIEBENSAT.1NA O.N. - 1H