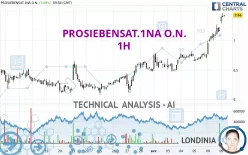
PROSIEBENSAT.1NA O.N. - 1H - Technical analysis published on 04/09/2024 (GMT)
- 139
- 0
Click here for a new analysis!
- Timeframe : 1H
- - Analysis generated on
- Status : INVALID

Summary of the analysis

Additional analysis
Quotes
PROSIEBENSAT.1NA O.N. rating 7.425 EUR. On the day, this instrument gained +3.48% with the lowest point at 7.155 EUR and the highest point at 7.475 EUR. The deviation from the price is +3.77% for the low point and -0.67% for the high point.The Central Gaps scanner detects a bullish opening. A small advantage for buyers in the very short term.
Bullish opening
Type : Bullish
Timeframe : Openning
Here is a more detailed summary of the historical variations registered by PROSIEBENSAT.1NA O.N.:
New HIGH record (1st january)
Type : Bullish
Timeframe : Weekly
New HIGH record (1 month)
Type : Bullish
Timeframe : Weekly
Technical
A technical analysis in 1H of this PROSIEBENSAT.1NA O.N. chart shows a strongly bullish trend. 92.86% of the signals given by moving averages are bullish. This strongly bullish trend is supported by the strong bullish signals given by short-term moving averages. The Central Indicators scanner does not detect any result on moving averages that would impact this trend.
In fact, 16 technical indicators on 18 studied are currently bullish. Caution: the Central Indicators scanner currently detects an excess:
RSI indicator is overbought : over 70
Type : Neutral
Timeframe : 1 hour
CCI indicator is overbought : over 100
Type : Neutral
Timeframe : 1 hour
Williams %R indicator is overbought : over -20
Type : Neutral
Timeframe : 1 hour
Pivot points : price is over resistance 1
Type : Neutral
Timeframe : 1 hour
Pivot points : price is over resistance 3
Type : Neutral
Timeframe : Weekly
Central Patterns, the market scanner focusing on chart patterns, resistances and supports found these results:
Horizontal resistance is broken
Type : Bullish
Timeframe : 1 hour
Resistance of channel is broken
Type : Bullish
Timeframe : 1 hour
Central Candlesticks, the scanner specialised in Japanese candlesticks, detects a bearish signal that could support the hypothesis of a small drop in the very short term:
Bearish harami
Type : Bearish
Timeframe : 1 hour
| S3 | S2 | S1 | Price | R1 | R2 | R3 | |
|---|---|---|---|---|---|---|---|
| ProTrendLines | 6.648 | 6.904 | 7.378 | 7.425 | 8.182 | 8.545 | 9.052 |
| Change (%) | -10.46% | -7.02% | -0.63% | - | +10.20% | +15.08% | +21.91% |
| Change | -0.777 | -0.521 | -0.047 | - | +0.757 | +1.120 | +1.627 |
| Level | Major | Minor | Minor | - | Minor | Minor | Major |
To determine price objectives, it is also possible to use the pivot points. Here is the price position in relation to pivot points:
| Pivot points | S3 | S2 | S1 | PP | R1 | R2 | R3 |
|---|---|---|---|---|---|---|---|
| Standard | 6.358 | 6.562 | 6.868 | 7.072 | 7.378 | 7.582 | 7.888 |
| Camarilla | 7.035 | 7.082 | 7.128 | 7.175 | 7.222 | 7.269 | 7.315 |
| Woodie | 6.410 | 6.588 | 6.920 | 7.098 | 7.430 | 7.608 | 7.940 |
| Fibonacci | 6.562 | 6.757 | 6.877 | 7.072 | 7.267 | 7.387 | 7.582 |
| Pivot points | S3 | S2 | S1 | PP | R1 | R2 | R3 |
|---|---|---|---|---|---|---|---|
| Standard | 6.163 | 6.317 | 6.513 | 6.667 | 6.863 | 7.017 | 7.213 |
| Camarilla | 6.614 | 6.646 | 6.678 | 6.710 | 6.742 | 6.774 | 6.806 |
| Woodie | 6.185 | 6.328 | 6.535 | 6.678 | 6.885 | 7.028 | 7.235 |
| Fibonacci | 6.317 | 6.450 | 6.533 | 6.667 | 6.800 | 6.883 | 7.017 |
| Pivot points | S3 | S2 | S1 | PP | R1 | R2 | R3 |
|---|---|---|---|---|---|---|---|
| Standard | 4.973 | 5.437 | 5.975 | 6.439 | 6.977 | 7.441 | 7.979 |
| Camarilla | 6.237 | 6.328 | 6.420 | 6.512 | 6.604 | 6.696 | 6.788 |
| Woodie | 5.009 | 5.456 | 6.011 | 6.458 | 7.013 | 7.460 | 8.015 |
| Fibonacci | 5.437 | 5.820 | 6.057 | 6.439 | 6.822 | 7.059 | 7.441 |
Numerical data
The following is the status of technical indicators and moving averages registered at the time this technical analysis was created:
| RSI (14): | 80.66 | |
| MACD (12,26,9): | 0.1760 | |
| Directional Movement: | 38.023 | |
| AROON (14): | 78.571 | |
| DEMA (21): | 7.270 | |
| Parabolic SAR (0,02-0,02-0,2): | 7.155 | |
| Elder Ray (13): | 0.279 | |
| Super Trend (3,10): | 7.119 | |
| Zig ZAG (10): | 7.435 | |
| VORTEX (21): | 1.2610 | |
| Stochastique (14,3,5): | 91.60 | |
| TEMA (21): | 7.351 | |
| Williams %R (14): | -10.46 | |
| Chande Momentum Oscillator (20): | 0.685 | |
| Repulse (5,40,3): | 0.8390 | |
| ROCnROLL: | 1 | |
| TRIX (15,9): | 0.2800 | |
| Courbe Coppock: | 14.97 |
| MA7: | 6.833 | |
| MA20: | 6.540 | |
| MA50: | 6.252 | |
| MA100: | 6.016 | |
| MAexp7: | 7.260 | |
| MAexp20: | 7.056 | |
| MAexp50: | 6.831 | |
| MAexp100: | 6.658 | |
| Price / MA7: | +8.66% | |
| Price / MA20: | +13.53% | |
| Price / MA50: | +18.76% | |
| Price / MA100: | +23.42% | |
| Price / MAexp7: | +2.27% | |
| Price / MAexp20: | +5.23% | |
| Price / MAexp50: | +8.70% | |
| Price / MAexp100: | +11.52% |
News
Don't forget to follow the news on PROSIEBENSAT.1NA O.N.. At the time of publication of this analysis, the latest news was as follows:
- EQS-Adhoc: ProSiebenSat.1 records a higher than expected increase in earnings in the fourth quarter of 2023 and specifies its outlook for 2024
- EQS-Adhoc: ProSiebenSat.1 increases investments in local content and at the same time expects stable earnings next year – impairment on programming assets in 2023
- EQS-Adhoc: ProSiebenSat.1 Media SE adjusts dividend policy, proposes significantly reduced dividend for fiscal year 2022 and announces change in the Executive Board
- EQS-Adhoc: ProSiebenSat.1 Media SE postpones presentation of Annual and Consolidated Financial Statements and possibly also Annual General Meeting
- EQS-Adhoc: ProSiebenSat.1 updates full-year outlook 2022 due to development of the macroeconomic environment / Non-cash impairment of assets within the cash-generating unit of NuCom Group
About author
Online


Add a comment
Comments
0 comments on the analysis PROSIEBENSAT.1NA O.N. - 1H