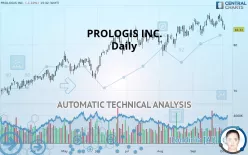
PROLOGIS INC. - Daily - Technical analysis published on 10/02/2019 (GMT)
- 324
- 0
- Who voted?
Click here for a new analysis!
- Timeframe : Daily
- - Analysis generated on
- Status : TARGET REACHED

Summary of the analysis

Additional analysis
Quotes
The PROLOGIS INC. price is 83.32 USD. The price is lower by -1.10% since the last closing and was traded between 83.26 USD and 84.50 USD over the period. The price is currently at +0.07% from its lowest and -1.40% from its highest.The Central Gaps scanner detects a bearish opening marking the presence of sellers ahead of buyers at the opening but not sufficiently marked to allow the price to register a quotation gap.
Bearish opening
Type : Bearish
Timeframe : Openning
A study of price movements over other periods shows the following variations:
Near a new HIGH record (5 years)
Type : Bullish
Timeframe : Weekly
Near a new HIGH record (1 year)
Type : Bullish
Timeframe : Weekly
Near a new HIGH record (1st january)
Type : Bullish
Timeframe : Weekly
Technical
Technical analysis of PROLOGIS INC. in Daily shows an overall bullish trend. 71.43% of the signals given by moving averages are bullish. Caution: the neutral signals currently given by the short-term moving averages indicate that this bullish trend is showing signs of running out of steam. An assessment of moving averages reveals several bearish signals that could impact this trend:
Bearish trend reversal : adaptative moving average 20
Type : Bearish
Timeframe : Daily
Bearish price crossover with Moving Average 20
Type : Bearish
Timeframe : Daily
On the 18 technical indicators analysed, 4 are bullish, 7 are neutral and 7 are bearish. Central Indicators, the scanner specialised in technical indicators, has identified these signals:
Pivot points : price is under support 1
Type : Neutral
Timeframe : Weekly
MACD crosses DOWN its Moving Average
Type : Bearish
Timeframe : Daily
Parabolic SAR indicator bearish reversal
Type : Bearish
Timeframe : Daily
Price is back over the pivot point
Type : Bullish
Timeframe : Weekly
Price is back under the pivot point
Type : Bearish
Timeframe : Daily
Williams %R indicator is back under -50
Type : Bearish
Timeframe : Daily
No signals are given by Central Patterns, a market scanner specialised in chart patterns, resistances and supports.
No result was found by the Central Candlesticks scanner on Japanese candlesticks.
| S3 | S2 | S1 | Price | R1 | |
|---|---|---|---|---|---|
| ProTrendLines | 72.31 | 78.64 | 83.02 | 83.32 | 86.44 |
| Change (%) | -13.21% | -5.62% | -0.36% | - | +3.74% |
| Change | -11.01 | -4.68 | -0.30 | - | +3.12 |
| Level | Minor | Minor | Major | - | Intermediate |
Pivot points can also be used to set your price objectives. Here is the price situation in relation to pivot points:
| Pivot points | S3 | S2 | S1 | PP | R1 | R2 | R3 |
|---|---|---|---|---|---|---|---|
| Standard | 81.49 | 82.61 | 83.43 | 84.55 | 85.37 | 86.49 | 87.31 |
| Camarilla | 83.72 | 83.89 | 84.07 | 84.25 | 84.43 | 84.61 | 84.78 |
| Woodie | 81.34 | 82.54 | 83.28 | 84.48 | 85.22 | 86.42 | 87.16 |
| Fibonacci | 82.61 | 83.35 | 83.81 | 84.55 | 85.29 | 85.75 | 86.49 |
| Pivot points | S3 | S2 | S1 | PP | R1 | R2 | R3 |
|---|---|---|---|---|---|---|---|
| Standard | 81.21 | 82.49 | 84.14 | 85.42 | 87.07 | 88.35 | 90.00 |
| Camarilla | 84.97 | 85.24 | 85.51 | 85.78 | 86.05 | 86.32 | 86.59 |
| Woodie | 81.39 | 82.58 | 84.32 | 85.51 | 87.25 | 88.44 | 90.18 |
| Fibonacci | 82.49 | 83.61 | 84.30 | 85.42 | 86.54 | 87.23 | 88.35 |
| Pivot points | S3 | S2 | S1 | PP | R1 | R2 | R3 |
|---|---|---|---|---|---|---|---|
| Standard | 76.80 | 79.08 | 82.15 | 84.43 | 87.50 | 89.78 | 92.85 |
| Camarilla | 83.75 | 84.24 | 84.73 | 85.22 | 85.71 | 86.20 | 86.69 |
| Woodie | 77.19 | 79.28 | 82.54 | 84.63 | 87.90 | 89.98 | 93.25 |
| Fibonacci | 79.08 | 81.12 | 82.39 | 84.43 | 86.47 | 87.74 | 89.78 |
Numerical data
The following are the details of the technical indicators and moving averages that were collected to generate this technical analysis:
| RSI (14): | 47.83 | |
| MACD (12,26,9): | 0.5700 | |
| Directional Movement: | -0.95 | |
| AROON (14): | 78.57 | |
| DEMA (21): | 85.16 | |
| Parabolic SAR (0,02-0,02-0,2): | 86.65 | |
| Elder Ray (13): | -0.68 | |
| Super Trend (3,10): | 81.52 | |
| Zig ZAG (10): | 83.57 | |
| VORTEX (21): | 0.9800 | |
| Stochastique (14,3,5): | 40.38 | |
| TEMA (21): | 85.03 | |
| Williams %R (14): | -92.23 | |
| Chande Momentum Oscillator (20): | -1.13 | |
| Repulse (5,40,3): | -2.2700 | |
| ROCnROLL: | -1 | |
| TRIX (15,9): | 0.1300 | |
| Courbe Coppock: | 2.47 |
| MA7: | 84.91 | |
| MA20: | 84.42 | |
| MA50: | 82.72 | |
| MA100: | 80.46 | |
| MAexp7: | 84.61 | |
| MAexp20: | 84.32 | |
| MAexp50: | 82.89 | |
| MAexp100: | 80.36 | |
| Price / MA7: | -1.87% | |
| Price / MA20: | -1.30% | |
| Price / MA50: | +0.73% | |
| Price / MA100: | +3.55% | |
| Price / MAexp7: | -1.52% | |
| Price / MAexp20: | -1.19% | |
| Price / MAexp50: | +0.52% | |
| Price / MAexp100: | +3.68% |
News
The latest news and videos published on PROLOGIS INC. at the time of the analysis were as follows:
- FIBRA Prologis to Host Third Quarter 2019 Earnings Conference Call October 17
- Prologis Recognized for Industry-Leading Global ESG Initiatives
- Prologis to Announce Third Quarter 2019 Results October 15
- Prologis Declares Quarterly Dividends
- Prologis to Participate in Industry Conferences in New York City
About author

Online


Add a comment
Comments
0 comments on the analysis PROLOGIS INC. - Daily