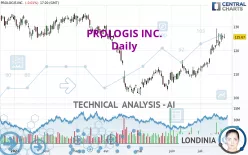
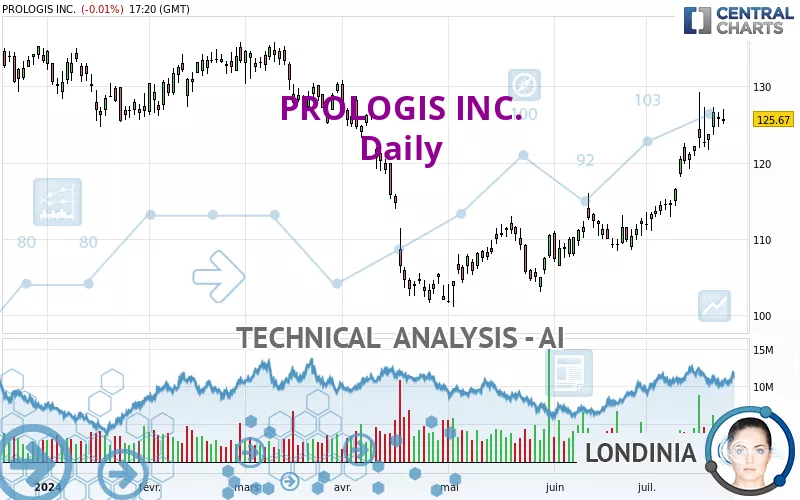
PROLOGIS INC. - Daily - Technical analysis published on 07/24/2024 (GMT)
- 195
- 0
Click here for a new analysis!
- Timeframe : Daily
- - Analysis generated on
- Status : TARGET REACHED
Summary of the analysis

Additional analysis
Quotes
PROLOGIS INC. rating 125.67 USD. On the day, this instrument lost -0.01% with the lowest point at 125.09 USD and the highest point at 126.95 USD. The deviation from the price is +0.46% for the low point and -1.01% for the high point.The Central Gaps scanner detects a bearish opening marking the presence of sellers ahead of buyers at the opening but not sufficiently marked to allow the price to register a quotation gap.
Bearish opening
Type : Bearish
Timeframe : Openning
Here is a more detailed summary of the historical variations registered by PROLOGIS INC.:
Near a new HIGH record (1 month)
Type : Bullish
Timeframe : Weekly
Technical
Technical analysis of PROLOGIS INC. in Daily shows an overall bullish trend. 75.00% of the signals given by moving averages are bullish. This bullish trend is supported by the strong bullish signals given by short-term moving averages. There is no crossing of moving average by the price or crossing of moving averages between themselves.
An assessment of technical indicators shows a strong bullish signal.
But beware of excesses. The Central Indicators scanner currently detects this:
RSI indicator is overbought : over 70
Type : Neutral
Timeframe : Daily
CCI indicator is overbought : over 100
Type : Neutral
Timeframe : Daily
Price is back over the pivot point
Type : Bullish
Timeframe : Daily
The Central Patterns scanner, which studies chart patterns, resistances and supports, has identified this signal:
Near resistance of triangle
Type : Bearish
Timeframe : Daily
No result was found by the Central Candlesticks scanner on Japanese candlesticks.
| S3 | S2 | S1 | Price | R1 | R2 | R3 | |
|---|---|---|---|---|---|---|---|
| ProTrendLines | 107.22 | 111.80 | 118.03 | 125.67 | 125.76 | 129.04 | 134.08 |
| Change (%) | -14.68% | -11.04% | -6.08% | - | +0.07% | +2.68% | +6.69% |
| Change | -18.45 | -13.87 | -7.64 | - | +0.09 | +3.37 | +8.41 |
| Level | Intermediate | Major | Major | - | Major | Intermediate | Major |
To determine price objectives, it is also possible to use the pivot points. Here is the price position in relation to pivot points:
| Pivot points | S3 | S2 | S1 | PP | R1 | R2 | R3 |
|---|---|---|---|---|---|---|---|
| Standard | 122.67 | 123.63 | 124.66 | 125.62 | 126.65 | 127.61 | 128.64 |
| Camarilla | 125.13 | 125.32 | 125.50 | 125.68 | 125.86 | 126.05 | 126.23 |
| Woodie | 122.70 | 123.65 | 124.69 | 125.64 | 126.68 | 127.63 | 128.67 |
| Fibonacci | 123.63 | 124.39 | 124.86 | 125.62 | 126.38 | 126.85 | 127.61 |
| Pivot points | S3 | S2 | S1 | PP | R1 | R2 | R3 |
|---|---|---|---|---|---|---|---|
| Standard | 108.87 | 114.01 | 118.88 | 124.02 | 128.89 | 134.03 | 138.90 |
| Camarilla | 121.00 | 121.92 | 122.83 | 123.75 | 124.67 | 125.59 | 126.50 |
| Woodie | 108.74 | 113.94 | 118.75 | 123.95 | 128.76 | 133.96 | 138.77 |
| Fibonacci | 114.01 | 117.83 | 120.20 | 124.02 | 127.84 | 130.21 | 134.03 |
| Pivot points | S3 | S2 | S1 | PP | R1 | R2 | R3 |
|---|---|---|---|---|---|---|---|
| Standard | 97.52 | 101.56 | 106.93 | 110.97 | 116.34 | 120.38 | 125.75 |
| Camarilla | 109.72 | 110.59 | 111.45 | 112.31 | 113.17 | 114.04 | 114.90 |
| Woodie | 98.20 | 101.89 | 107.61 | 111.30 | 117.02 | 120.71 | 126.43 |
| Fibonacci | 101.56 | 105.15 | 107.37 | 110.97 | 114.56 | 116.78 | 120.38 |
Numerical data
The following is the status of the technical indicators and moving averages at the time of publication of this technical analysis:
| RSI (14): | 77.93 | |
| MACD (12,26,9): | 3.9700 | |
| Directional Movement: | 34.14 | |
| AROON (14): | 42.86 | |
| DEMA (21): | 124.33 | |
| Parabolic SAR (0,02-0,02-0,2): | 121.07 | |
| Elder Ray (13): | 4.37 | |
| Super Trend (3,10): | 117.47 | |
| Zig ZAG (10): | 125.76 | |
| VORTEX (21): | 1.2400 | |
| Stochastique (14,3,5): | 81.42 | |
| TEMA (21): | 126.70 | |
| Williams %R (14): | -20.56 | |
| Chande Momentum Oscillator (20): | 11.39 | |
| Repulse (5,40,3): | 0.6600 | |
| ROCnROLL: | 1 | |
| TRIX (15,9): | 0.4200 | |
| Courbe Coppock: | 20.54 |
| MA7: | 124.18 | |
| MA20: | 118.16 | |
| MA50: | 112.52 | |
| MA100: | 115.42 | |
| MAexp7: | 124.04 | |
| MAexp20: | 119.46 | |
| MAexp50: | 115.49 | |
| MAexp100: | 115.63 | |
| Price / MA7: | +1.20% | |
| Price / MA20: | +6.36% | |
| Price / MA50: | +11.69% | |
| Price / MA100: | +8.88% | |
| Price / MAexp7: | +1.31% | |
| Price / MAexp20: | +5.20% | |
| Price / MAexp50: | +8.81% | |
| Price / MAexp100: | +8.68% |
News
The last news published on PROLOGIS INC. at the time of the generation of this analysis was as follows:
- FIBRA Prologis Announces Second Quarter 2024 Earnings Results
- Prologis Reports Second Quarter Results
- FIBRA Prologis Acquires 0.3 Million Square Feet
- Prologis to Announce Second Quarter 2024 Results July 17
- FIBRA Prologis to Host Second Quarter 2024 Earnings Conference Call July 18
About author
Online


Add a comment
Comments
0 comments on the analysis PROLOGIS INC. - Daily