| Open: | - |
| Change: | - |
| Volume: | - |
| Low: | - |
| High: | - |
| High / Low range: | - |
| Type: | Stocks |
| Ticker: | PG |
| ISIN: |
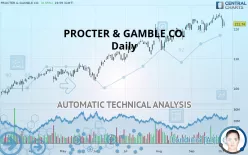
PROCTER & GAMBLE CO. - Daily - Technical analysis published on 10/03/2019 (GMT)
- 285
- 0
- 10/03/2019 - 21:17
- Who voted?
Click here for a new analysis!
- Timeframe : Daily
- - Analysis generated on 10/03/2019 - 21:16
- Status : TARGET REACHED

Summary of the analysis

Additional analysis
Quotes
PROCTER & GAMBLE CO. rating 121.74 USD. On the day, this instrument gained +0.55% and was traded between 120.84 USD and 122.54 USD over the period. The price is currently at +0.74% from its lowest and -0.65% from its highest.A bullish opening was detected by the Central Gaps scanner. Buyers are trying to impose a bullish momentum in the very short term.
Bullish opening
Type : Bullish
Timeframe : Openning
A study of price movements over other periods shows the following variations:
New HIGH record (5 years)
Type : Bullish
Timeframe : Weekly
Near a new HIGH record (1 year)
Type : Bullish
Timeframe : Weekly
Near a new HIGH record (1st january)
Type : Bullish
Timeframe : Weekly
Technical
Technical analysis of this Daily chart of PROCTER & GAMBLE CO. indicates that the overall trend is bullish. 71.43% of the signals given by moving averages are bullish. Caution: the neutral signals currently given by the short-term moving averages indicate that this bullish trend is showing signs of running out of steam. The Central Indicators market scanner is currently detecting several bearish signals that could impact this trend:
Bearish trend reversal : Moving Average 20
Type : Bearish
Timeframe : Daily
Bearish trend reversal : adaptative moving average 20
Type : Bearish
Timeframe : Daily
Bearish price crossover with Moving Average 20
Type : Bearish
Timeframe : Daily
In fact, of the 18 technical indicators analysed by Central Analyzer, 5 are bullish, 8 are neutral and 5 are bearish. Central Indicators, the detector scanner for these technical indicators has recently detected several signals:
Pivot points : price is under support 1
Type : Neutral
Timeframe : Weekly
RSI indicator is back under 50
Type : Bearish
Timeframe : Daily
MACD crosses DOWN its Moving Average
Type : Bearish
Timeframe : Daily
Parabolic SAR indicator bearish reversal
Type : Bearish
Timeframe : Daily
Price is back over the pivot point
Type : Bullish
Timeframe : Weekly
Price is back under the pivot point
Type : Bearish
Timeframe : Daily
Williams %R indicator is back under -50
Type : Bearish
Timeframe : Daily
An analysis of the price chart with the Central Patterns scanner (detector of chart patterns and resistances and supports) shows a result that can have an impact on the price change:
Horizontal support is broken
Type : Bearish
Timeframe : Daily
The Central Candlesticks scanner, specialised in Japanese candlesticks, did not identify any signals.
| S3 | S2 | S1 | Price | R1 | |
|---|---|---|---|---|---|
| ProTrendLines | 102.94 | 112.51 | 120.41 | 121.74 | 123.12 |
| Change (%) | -15.44% | -7.58% | -1.09% | - | +1.13% |
| Change | -18.80 | -9.23 | -1.33 | - | +1.38 |
| Level | Major | Minor | Major | - | Major |
Attention could also be paid to pivot points to set price objectives:
| Pivot points | S3 | S2 | S1 | PP | R1 | R2 | R3 |
|---|---|---|---|---|---|---|---|
| Standard | 116.20 | 118.21 | 119.64 | 121.65 | 123.08 | 125.09 | 126.52 |
| Camarilla | 120.13 | 120.45 | 120.77 | 121.08 | 121.40 | 121.71 | 122.03 |
| Woodie | 115.92 | 118.07 | 119.36 | 121.51 | 122.80 | 124.95 | 126.24 |
| Fibonacci | 118.21 | 119.52 | 120.33 | 121.65 | 122.96 | 123.77 | 125.09 |
| Pivot points | S3 | S2 | S1 | PP | R1 | R2 | R3 |
|---|---|---|---|---|---|---|---|
| Standard | 119.66 | 120.82 | 122.69 | 123.85 | 125.72 | 126.88 | 128.75 |
| Camarilla | 123.74 | 124.02 | 124.29 | 124.57 | 124.85 | 125.13 | 125.40 |
| Woodie | 120.03 | 121.00 | 123.06 | 124.03 | 126.09 | 127.06 | 129.12 |
| Fibonacci | 120.82 | 121.97 | 122.69 | 123.85 | 125.00 | 125.72 | 126.88 |
| Pivot points | S3 | S2 | S1 | PP | R1 | R2 | R3 |
|---|---|---|---|---|---|---|---|
| Standard | 114.13 | 116.57 | 120.48 | 122.92 | 126.82 | 129.26 | 133.17 |
| Camarilla | 122.64 | 123.22 | 123.80 | 124.38 | 124.96 | 125.54 | 126.13 |
| Woodie | 114.86 | 116.94 | 121.21 | 123.28 | 127.55 | 129.63 | 133.90 |
| Fibonacci | 116.57 | 119.00 | 120.50 | 122.92 | 125.34 | 126.84 | 129.26 |
Numerical data
The following is the status of technical indicators and moving averages registered at the time this technical analysis was created:
| RSI (14): | 50.11 | |
| MACD (12,26,9): | 0.8900 | |
| Directional Movement: | -6.75 | |
| AROON (14): | 71.43 | |
| DEMA (21): | 123.60 | |
| Parabolic SAR (0,02-0,02-0,2): | 125.26 | |
| Elder Ray (13): | -0.95 | |
| Super Trend (3,10): | 120.02 | |
| Zig ZAG (10): | 121.74 | |
| VORTEX (21): | 0.9400 | |
| Stochastique (14,3,5): | 50.56 | |
| TEMA (21): | 123.16 | |
| Williams %R (14): | -57.05 | |
| Chande Momentum Oscillator (20): | 0.58 | |
| Repulse (5,40,3): | -1.5200 | |
| ROCnROLL: | -1 | |
| TRIX (15,9): | 0.1400 | |
| Courbe Coppock: | 2.36 |
| MA7: | 123.28 | |
| MA20: | 122.37 | |
| MA50: | 119.80 | |
| MA100: | 114.64 | |
| MAexp7: | 122.72 | |
| MAexp20: | 122.24 | |
| MAexp50: | 119.67 | |
| MAexp100: | 115.21 | |
| Price / MA7: | -1.25% | |
| Price / MA20: | -0.51% | |
| Price / MA50: | +1.62% | |
| Price / MA100: | +6.19% | |
| Price / MAexp7: | -0.80% | |
| Price / MAexp20: | -0.41% | |
| Price / MAexp50: | +1.73% | |
| Price / MAexp100: | +5.67% |
News
The last news published on PROCTER & GAMBLE CO. at the time of the generation of this analysis was as follows:
- 10/02/2019 - 19:48 PG&E Celebrates 4th Annual National Energy Efficiency Day
- 10/01/2019 - 14:11 ALWAYS DISCREET® Aims to Show Women with Bladder Leaks Are Not What You Expect
- 10/01/2019 - 13:00 P&G To Webcast Presentation From the Procter & Gamble 2019 Annual Meeting of Shareholders October 8
- 09/26/2019 - 16:57 Procter & Gamble Brings Relief to Texas Residents Affected by Severe Flooding With P&G Product Kits and Tide Loads of Hope Laundry Services
- 09/26/2019 - 01:56 PG&E Patrolling Areas Affected by Today’s PSPS Event Electric Service Already Restored in Most Areas
About author

Online


Add a comment
Comments
0 comments on the analysis PROCTER & GAMBLE CO. - Daily