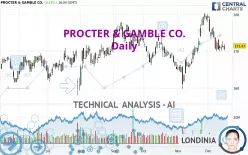
PROCTER & GAMBLE CO. - Daily - Technical analysis published on 12/17/2024 (GMT)
- 88
- 0
Click here for a new analysis!
- Timeframe : Daily
- - Analysis generated on
- Status : INVALID

Summary of the analysis

Additional analysis
Quotes
The PROCTER & GAMBLE CO. price is 171.46 USD. The price has increased by +0.19% since the last closing and was traded between 170.22 USD and 171.95 USD over the period. The price is currently at +0.73% from its lowest and -0.28% from its highest.Here is a more detailed summary of the historical variations registered by PROCTER & GAMBLE CO.:
Near a new HIGH record (5 years)
Type : Bullish
Timeframe : Weekly
Near a new LOW record (1 month)
Type : Bearish
Timeframe : Weekly
Technical
A technical analysis in Daily of this PROCTER & GAMBLE CO. chart shows a bullish trend. The signals given by moving averages are 67.86% bullish. This bullish trend could slow down given the neutral signals currently being given by short-term moving averages. The Central Indicators scanner does not detect any result on moving averages that would impact this trend.
An assessment of technical indicators shows a bearish signal.
Central Indicators, the scanner specialised in technical indicators, has identified these signals:
Price is back over the pivot point
Type : Bullish
Timeframe : Daily
Price is back over the pivot point
Type : Bullish
Timeframe : Weekly
An analysis of the price chart with the Central Patterns scanner (detector of chart patterns and resistances and supports) shows a result that can have an impact on the price change:
Near support of channel
Type : Bullish
Timeframe : Daily
Central Candlesticks, the scanner specialised in Japanese candlesticks, detects a bullish signal that could support the hypothesis of a small rebound in the very short term:
Bullish engulfing lines
Type : Bullish
Timeframe : Daily
| S3 | S2 | S1 | Price | R1 | R2 | R3 | |
|---|---|---|---|---|---|---|---|
| ProTrendLines | 159.76 | 166.47 | 169.76 | 171.46 | 172.53 | 176.75 | 179.70 |
| Change (%) | -6.82% | -2.91% | -0.99% | - | +0.62% | +3.09% | +4.81% |
| Change | -11.70 | -4.99 | -1.70 | - | +1.07 | +5.29 | +8.24 |
| Level | Major | Major | Intermediate | - | Intermediate | Major | Major |
To determine price objectives, it is also possible to use the pivot points. Here is the price position in relation to pivot points:
| Pivot points | S3 | S2 | S1 | PP | R1 | R2 | R3 |
|---|---|---|---|---|---|---|---|
| Standard | 168.89 | 169.99 | 170.57 | 171.67 | 172.25 | 173.35 | 173.93 |
| Camarilla | 170.68 | 170.83 | 170.99 | 171.14 | 171.29 | 171.45 | 171.60 |
| Woodie | 168.62 | 169.86 | 170.30 | 171.54 | 171.98 | 173.22 | 173.66 |
| Fibonacci | 169.99 | 170.64 | 171.03 | 171.67 | 172.32 | 172.71 | 173.35 |
| Pivot points | S3 | S2 | S1 | PP | R1 | R2 | R3 |
|---|---|---|---|---|---|---|---|
| Standard | 165.58 | 167.75 | 169.41 | 171.58 | 173.24 | 175.41 | 177.07 |
| Camarilla | 170.01 | 170.36 | 170.71 | 171.06 | 171.41 | 171.76 | 172.11 |
| Woodie | 165.32 | 167.62 | 169.15 | 171.45 | 172.98 | 175.28 | 176.81 |
| Fibonacci | 167.75 | 169.22 | 170.12 | 171.58 | 173.05 | 173.95 | 175.41 |
| Pivot points | S3 | S2 | S1 | PP | R1 | R2 | R3 |
|---|---|---|---|---|---|---|---|
| Standard | 145.36 | 152.59 | 165.98 | 173.21 | 186.60 | 193.83 | 207.22 |
| Camarilla | 173.71 | 175.60 | 177.49 | 179.38 | 181.27 | 183.16 | 185.05 |
| Woodie | 148.45 | 154.13 | 169.07 | 174.75 | 189.69 | 195.37 | 210.31 |
| Fibonacci | 152.59 | 160.46 | 165.33 | 173.21 | 181.08 | 185.95 | 193.83 |
Numerical data
The following are the details of the technical indicators and moving averages that were collected to generate this technical analysis:
| RSI (14): | 47.12 | |
| MACD (12,26,9): | 0.1500 | |
| Directional Movement: | -2.37 | |
| AROON (14): | -57.15 | |
| DEMA (21): | 173.08 | |
| Parabolic SAR (0,02-0,02-0,2): | 177.05 | |
| Elder Ray (13): | -1.57 | |
| Super Trend (3,10): | 177.83 | |
| Zig ZAG (10): | 171.44 | |
| VORTEX (21): | 1.0200 | |
| Stochastique (14,3,5): | 11.68 | |
| TEMA (21): | 172.34 | |
| Williams %R (14): | -88.14 | |
| Chande Momentum Oscillator (20): | -8.20 | |
| Repulse (5,40,3): | -0.5400 | |
| ROCnROLL: | -1 | |
| TRIX (15,9): | 0.0900 | |
| Courbe Coppock: | 4.84 |
| MA7: | 171.08 | |
| MA20: | 174.21 | |
| MA50: | 170.48 | |
| MA100: | 170.27 | |
| MAexp7: | 171.63 | |
| MAexp20: | 172.44 | |
| MAexp50: | 171.37 | |
| MAexp100: | 169.57 | |
| Price / MA7: | +0.22% | |
| Price / MA20: | -1.58% | |
| Price / MA50: | +0.57% | |
| Price / MA100: | +0.70% | |
| Price / MAexp7: | -0.10% | |
| Price / MAexp20: | -0.57% | |
| Price / MAexp50: | +0.05% | |
| Price / MAexp100: | +1.11% |
News
The latest news and videos published on PROCTER & GAMBLE CO. at the time of the analysis were as follows:
- Braun IPLs Light Up Group Chats with a Major Deal This Holiday Season
- Welcome New Holiday Scents: Old Spice’s Limited-Edition Snickerdudel and Lumbersnack
- P&G to Webcast Presentation From the Morgan Stanley Global Consumer & Retail Conference, December 3
- Luvs Teams Up with Feeding America® to Support Families This Holiday Season
- The LPGA's Kroger Queen City Championship Presented by P&G Returns to Cincinnati Uplifting Women in Sports, Business and Education
About author

Online


Add a comment
Comments
0 comments on the analysis PROCTER & GAMBLE CO. - Daily