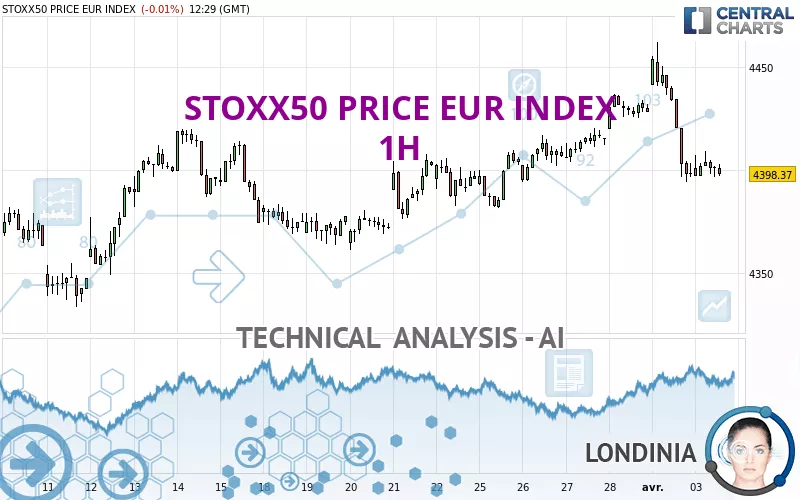
STOXX50 PRICE EUR INDEX - 1H - Technical analysis published on 04/03/2024 (GMT)
- 118
- 0
Click here for a new analysis!
- Timeframe : 1H
- - Analysis generated on
- Status : TARGET REACHED

Summary of the analysis

Additional analysis
Quotes
STOXX50 PRICE EUR INDEX rating 4,398.05 EUR. On the day, this instrument lost -0.02% and was between 4,396.83 EUR and 4,409.38 EUR. This implies that the price is at +0.03% from its lowest and at -0.26% from its highest.Here is a more detailed summary of the historical variations registered by STOXX50 PRICE EUR INDEX:
New HIGH record (5 years)
Type : Bullish
Timeframe : Weekly
Near a new HIGH record (1 year)
Type : Bullish
Timeframe : Weekly
Near a new HIGH record (1st january)
Type : Bullish
Timeframe : Weekly
Near a new LOW record (1 month)
Type : Bearish
Timeframe : Weekly
Technical
Technical analysis of STOXX50 PRICE EUR INDEX in 1H shows an overall slightly bearish trend. 60.71% of the signals given by moving averages are bearish. The overall trend could accelerate as a result of the strong bearish signals from short-term moving averages. The Central Indicators scanner detects a bearish signal on moving averages that could impact this trend:
Bearish price crossover with adaptative moving average 100
Type : Bearish
Timeframe : 1 hour
The probability of a further decline is moderate given the direction of the technical indicators.
Caution: the Central Indicators scanner currently detects an excess:
Williams %R indicator is oversold : under -80
Type : Neutral
Timeframe : 1 hour
Price is back under the pivot point
Type : Bearish
Timeframe : Weekly
Central Patterns, the scanner specializing in chart patterns, did not identify any signals.
The Central Candlesticks scanner which studies Japanese candlesticks did not detect anything.
| S3 | S2 | S1 | Price | R1 | R2 | R3 | |
|---|---|---|---|---|---|---|---|
| ProTrendLines | 4,319.54 | 4,361.10 | 4,381.95 | 4,398.05 | 4,399.73 | 4,420.04 | 4,436.94 |
| Change (%) | -1.79% | -0.84% | -0.37% | - | +0.04% | +0.50% | +0.88% |
| Change | -78.51 | -36.95 | -16.10 | - | +1.68 | +21.99 | +38.89 |
| Level | Minor | Minor | Intermediate | - | Intermediate | Intermediate | Minor |
Attention could also be paid to pivot points to set price objectives:
| Pivot points | S3 | S2 | S1 | PP | R1 | R2 | R3 |
|---|---|---|---|---|---|---|---|
| Standard | 4,306.27 | 4,350.17 | 4,374.49 | 4,418.39 | 4,442.71 | 4,486.61 | 4,510.93 |
| Camarilla | 4,380.05 | 4,386.30 | 4,392.56 | 4,398.81 | 4,405.06 | 4,411.32 | 4,417.57 |
| Woodie | 4,296.48 | 4,345.28 | 4,364.70 | 4,413.50 | 4,432.92 | 4,481.72 | 4,501.14 |
| Fibonacci | 4,350.17 | 4,376.23 | 4,392.33 | 4,418.39 | 4,444.45 | 4,460.55 | 4,486.61 |
| Pivot points | S3 | S2 | S1 | PP | R1 | R2 | R3 |
|---|---|---|---|---|---|---|---|
| Standard | 4,338.56 | 4,360.01 | 4,394.05 | 4,415.50 | 4,449.54 | 4,470.99 | 4,505.03 |
| Camarilla | 4,412.84 | 4,417.93 | 4,423.01 | 4,428.10 | 4,433.19 | 4,438.27 | 4,443.36 |
| Woodie | 4,344.87 | 4,363.16 | 4,400.36 | 4,418.65 | 4,455.85 | 4,474.14 | 4,511.34 |
| Fibonacci | 4,360.01 | 4,381.20 | 4,394.30 | 4,415.50 | 4,436.69 | 4,449.79 | 4,470.99 |
| Pivot points | S3 | S2 | S1 | PP | R1 | R2 | R3 |
|---|---|---|---|---|---|---|---|
| Standard | 4,167.78 | 4,223.38 | 4,325.74 | 4,381.34 | 4,483.70 | 4,539.30 | 4,641.66 |
| Camarilla | 4,384.66 | 4,399.14 | 4,413.62 | 4,428.10 | 4,442.58 | 4,457.06 | 4,471.54 |
| Woodie | 4,191.16 | 4,235.07 | 4,349.12 | 4,393.03 | 4,507.08 | 4,550.99 | 4,665.04 |
| Fibonacci | 4,223.38 | 4,283.72 | 4,321.00 | 4,381.34 | 4,441.68 | 4,478.96 | 4,539.30 |
Numerical data
The following is the status of the technical indicators and moving averages at the time of publication of this technical analysis:
| RSI (14): | 38.84 | |
| MACD (12,26,9): | -5.4500 | |
| Directional Movement: | -4.44 | |
| AROON (14): | -42.86 | |
| DEMA (21): | 4,407.25 | |
| Parabolic SAR (0,02-0,02-0,2): | 4,436.09 | |
| Elder Ray (13): | -7.67 | |
| Super Trend (3,10): | 4,427.13 | |
| Zig ZAG (10): | 4,399.22 | |
| VORTEX (21): | 0.7800 | |
| Stochastique (14,3,5): | 9.99 | |
| TEMA (21): | 4,398.71 | |
| Williams %R (14): | -90.27 | |
| Chande Momentum Oscillator (20): | -45.68 | |
| Repulse (5,40,3): | -0.0500 | |
| ROCnROLL: | 2 | |
| TRIX (15,9): | -0.0100 | |
| Courbe Coppock: | 1.60 |
| MA7: | 4,407.63 | |
| MA20: | 4,382.03 | |
| MA50: | 4,292.94 | |
| MA100: | 4,160.42 | |
| MAexp7: | 4,403.58 | |
| MAexp20: | 4,412.18 | |
| MAexp50: | 4,411.11 | |
| MAexp100: | 4,399.69 | |
| Price / MA7: | -0.22% | |
| Price / MA20: | +0.37% | |
| Price / MA50: | +2.45% | |
| Price / MA100: | +5.71% | |
| Price / MAexp7: | -0.13% | |
| Price / MAexp20: | -0.32% | |
| Price / MAexp50: | -0.30% | |
| Price / MAexp100: | -0.04% |
About author
Online


Add a comment
Comments
0 comments on the analysis STOXX50 PRICE EUR INDEX - 1H