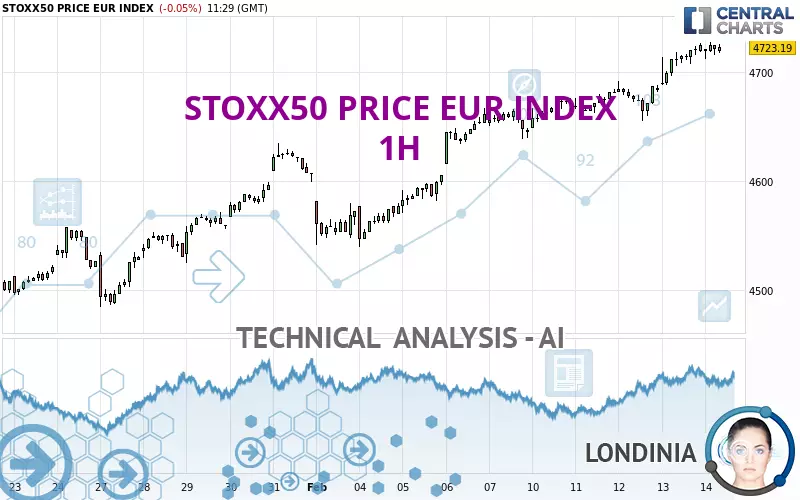
STOXX50 PRICE EUR INDEX - 1H - Technical analysis published on 02/14/2025 (GMT)
- 143
- 0
Click here for a new analysis!
- Timeframe : 1H
- - Analysis generated on
- Status : LEVEL MAINTAINED
Summary of the analysis

Additional analysis
Quotes
The STOXX50 PRICE EUR INDEX price is 4,723.19 EUR. The price registered a decrease of -0.05% on the session and was between 4,711.82 EUR and 4,727.81 EUR. This implies that the price is at +0.24% from its lowest and at -0.10% from its highest.A bearish opening was detected by the Central Gaps scanner. Sellers are trying to impose a bearish trend in the very short term.
Bearish opening
Type : Bearish
Timeframe : Openning
Here is a more detailed summary of the historical variations registered by STOXX50 PRICE EUR INDEX:
New HIGH record (5 years)
Type : Bullish
Timeframe : Weekly
New HIGH record (1 year)
Type : Bullish
Timeframe : Weekly
New HIGH record (1st january)
Type : Bullish
Timeframe : Weekly
New HIGH record (1 month)
Type : Bullish
Timeframe : Weekly
Technical
Technical analysis of STOXX50 PRICE EUR INDEX in 1H shows a strongly overall bullish trend. 92.86% of the signals given by moving averages are bullish. The overall trend is supported by the strong bullish signals from short-term moving averages. There is no crossing of moving average by the price or crossing of moving averages between themselves.
The technical indicators are bullish. There is still some doubt about the price increase.
Central Indicators, the scanner specialised in technical indicators, has identified this signal:
Pivot points : price is over resistance 1
Type : Neutral
Timeframe : Weekly
The analysis of the price chart with Central Patterns scanners does not return any result.
Central Candlesticks, the scanner specialised in Japanese candlesticks, detects this inversion signal that could impact the current short-term trend:
Doji
Type : Neutral
Timeframe : 1 hour
| S3 | S2 | S1 | Price | |
|---|---|---|---|---|
| ProTrendLines | 4,577.60 | 4,654.90 | 4,692.36 | 4,723.19 |
| Change (%) | -3.08% | -1.45% | -0.65% | - |
| Change | -145.59 | -68.29 | -30.83 | - |
| Level | Major | Minor | Minor | - |
To determine price objectives, it is also possible to use the pivot points. Here is the price position in relation to pivot points:
| Pivot points | S3 | S2 | S1 | PP | R1 | R2 | R3 |
|---|---|---|---|---|---|---|---|
| Standard | 4,661.64 | 4,674.95 | 4,700.16 | 4,713.47 | 4,738.68 | 4,751.99 | 4,777.20 |
| Camarilla | 4,714.78 | 4,718.31 | 4,721.84 | 4,725.37 | 4,728.90 | 4,732.43 | 4,735.96 |
| Woodie | 4,667.59 | 4,677.93 | 4,706.11 | 4,716.45 | 4,744.63 | 4,754.97 | 4,783.15 |
| Fibonacci | 4,674.95 | 4,689.67 | 4,698.76 | 4,713.47 | 4,728.19 | 4,737.28 | 4,751.99 |
| Pivot points | S3 | S2 | S1 | PP | R1 | R2 | R3 |
|---|---|---|---|---|---|---|---|
| Standard | 4,440.21 | 4,489.83 | 4,567.60 | 4,617.22 | 4,694.99 | 4,744.61 | 4,822.38 |
| Camarilla | 4,610.33 | 4,622.01 | 4,633.68 | 4,645.36 | 4,657.04 | 4,668.72 | 4,680.39 |
| Woodie | 4,454.28 | 4,496.87 | 4,581.67 | 4,624.26 | 4,709.06 | 4,751.65 | 4,836.45 |
| Fibonacci | 4,489.83 | 4,538.50 | 4,568.56 | 4,617.22 | 4,665.89 | 4,695.95 | 4,744.61 |
| Pivot points | S3 | S2 | S1 | PP | R1 | R2 | R3 |
|---|---|---|---|---|---|---|---|
| Standard | 4,042.86 | 4,166.93 | 4,387.34 | 4,511.41 | 4,731.82 | 4,855.89 | 5,076.30 |
| Camarilla | 4,513.01 | 4,544.59 | 4,576.16 | 4,607.74 | 4,639.32 | 4,670.90 | 4,702.47 |
| Woodie | 4,091.02 | 4,191.02 | 4,435.50 | 4,535.50 | 4,779.98 | 4,879.98 | 5,124.46 |
| Fibonacci | 4,166.93 | 4,298.53 | 4,379.82 | 4,511.41 | 4,643.01 | 4,724.30 | 4,855.89 |
Numerical data
The following is the status of the technical indicators and moving averages at the time of publication of this technical analysis:
| RSI (14): | 66.69 | |
| MACD (12,26,9): | 14.5200 | |
| Directional Movement: | 19.90 | |
| AROON (14): | 92.86 | |
| DEMA (21): | 4,723.22 | |
| Parabolic SAR (0,02-0,02-0,2): | 4,702.45 | |
| Elder Ray (13): | 5.78 | |
| Super Trend (3,10): | 4,691.05 | |
| Zig ZAG (10): | 4,719.03 | |
| VORTEX (21): | 1.1100 | |
| Stochastique (14,3,5): | 88.12 | |
| TEMA (21): | 4,726.60 | |
| Williams %R (14): | -16.65 | |
| Chande Momentum Oscillator (20): | 31.31 | |
| Repulse (5,40,3): | 0.2000 | |
| ROCnROLL: | 1 | |
| TRIX (15,9): | 0.0400 | |
| Courbe Coppock: | 1.77 |
| MA7: | 4,684.74 | |
| MA20: | 4,593.50 | |
| MA50: | 4,461.62 | |
| MA100: | 4,421.61 | |
| MAexp7: | 4,720.16 | |
| MAexp20: | 4,703.59 | |
| MAexp50: | 4,677.13 | |
| MAexp100: | 4,638.56 | |
| Price / MA7: | +0.82% | |
| Price / MA20: | +2.82% | |
| Price / MA50: | +5.86% | |
| Price / MA100: | +6.82% | |
| Price / MAexp7: | +0.06% | |
| Price / MAexp20: | +0.42% | |
| Price / MAexp50: | +0.98% | |
| Price / MAexp100: | +1.82% |
About author
Online


Add a comment
Comments
0 comments on the analysis STOXX50 PRICE EUR INDEX - 1H