| Open: | - |
| Change: | - |
| Volume: | - |
| Low: | - |
| High: | - |
| High / Low range: | - |
| Type: | Stocks |
| Ticker: | ASML |
| ISIN: | NL0010273215 |
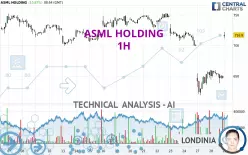
ASML HOLDING - 1H - Technical analysis published on 01/29/2025 (GMT)
- 121
- 0
- 01/29/2025 - 09:10
Click here for a new analysis!
- Timeframe : 1H
- - Analysis generated on 01/29/2025 - 09:10
- Status : TARGET REACHED

Summary of the analysis

Additional analysis
Quotes
The ASML HOLDING price is 716.9 EUR. The price registered an increase of +10.87% on the session and was traded between 711.5 EUR and 722.1 EUR over the period. The price is currently at +0.76% from its lowest and -0.72% from its highest.A bullish gap was detected at the opening by the Central Gaps scanner. There are a lot of buyers and they have the upper hand in the very short term.
Opening Gap UP
Type : Bullish
Timeframe : Openning
A study of price movements over other periods shows the following variations:
Near a new HIGH record (1 month)
Type : Bullish
Timeframe : Weekly
Technical
Technical analysis of ASML HOLDING in 1H shows an overall bearish trend. The signals given by moving averages are at 64.29% bearish. This bearish trend could slow down given the slightly bullish signals currently being given by short-term moving averages. An assessment of moving averages reveals several bullish signals that could impact this trend:
Bullish price crossover with Moving Average 20
Type : Bullish
Timeframe : 1 hour
Bullish price crossover with Moving Average 50
Type : Bullish
Timeframe : 1 hour
Bullish price crossover with Moving Average 100
Type : Bullish
Timeframe : 1 hour
Bullish price crossover with adaptative moving average 20
Type : Bullish
Timeframe : 1 hour
Bullish price crossover with adaptative moving average 50
Type : Bullish
Timeframe : 1 hour
Bullish price crossover with adaptative moving average 100
Type : Bullish
Timeframe : 1 hour
On the 18 technical indicators analysed, 5 are bullish, 6 are neutral and 7 are bearish. Caution: the Central Indicators scanner currently detects an excess:
CCI indicator is overbought : over 100
Type : Neutral
Timeframe : 1 hour
Williams %R indicator is overbought : over -20
Type : Neutral
Timeframe : 1 hour
RSI indicator is back over 50
Type : Bullish
Timeframe : 1 hour
SuperTrend indicator bullish reversal
Type : Bullish
Timeframe : 1 hour
Central Patterns, the market scanner focusing on chart patterns, resistances and supports found these results:
Near horizontal resistance
Type : Bearish
Timeframe : 1 hour
Resistance of channel is broken
Type : Bullish
Timeframe : 1 hour
The Central Candlesticks scanner, specialised in Japanese candlesticks, did not identify any signals.
| S3 | S2 | S1 | Price | R1 | R2 | R3 | |
|---|---|---|---|---|---|---|---|
| ProTrendLines | 612.2 | 674.6 | 699.2 | 716.9 | 727.1 | 747.7 | 808.1 |
| Change (%) | -14.60% | -5.90% | -2.47% | - | +1.42% | +4.30% | +12.72% |
| Change | -104.7 | -42.3 | -17.7 | - | +10.2 | +30.8 | +91.2 |
| Level | Major | Major | Minor | - | Minor | Major | Minor |
Pivot points can also be used to set your price objectives. Here is the price situation in relation to pivot points:
| Pivot points | S3 | S2 | S1 | PP | R1 | R2 | R3 |
|---|---|---|---|---|---|---|---|
| Standard | 615.5 | 627.0 | 636.8 | 648.3 | 658.1 | 669.6 | 679.4 |
| Camarilla | 640.7 | 642.7 | 644.7 | 646.6 | 648.6 | 650.5 | 652.5 |
| Woodie | 614.7 | 626.6 | 636.0 | 647.9 | 657.3 | 669.2 | 678.6 |
| Fibonacci | 627.0 | 635.1 | 640.2 | 648.3 | 656.4 | 661.5 | 669.6 |
| Pivot points | S3 | S2 | S1 | PP | R1 | R2 | R3 |
|---|---|---|---|---|---|---|---|
| Standard | 627.6 | 663.1 | 681.9 | 717.4 | 736.2 | 771.7 | 790.5 |
| Camarilla | 685.8 | 690.8 | 695.7 | 700.7 | 705.7 | 710.7 | 715.6 |
| Woodie | 619.3 | 658.9 | 673.6 | 713.2 | 727.9 | 767.5 | 782.2 |
| Fibonacci | 663.1 | 683.8 | 696.7 | 717.4 | 738.1 | 751.0 | 771.7 |
| Pivot points | S3 | S2 | S1 | PP | R1 | R2 | R3 |
|---|---|---|---|---|---|---|---|
| Standard | 563.0 | 603.4 | 641.1 | 681.5 | 719.2 | 759.6 | 797.3 |
| Camarilla | 657.2 | 664.4 | 671.5 | 678.7 | 685.9 | 693.0 | 700.2 |
| Woodie | 561.6 | 602.7 | 639.7 | 680.8 | 717.8 | 758.9 | 795.9 |
| Fibonacci | 603.4 | 633.3 | 651.7 | 681.5 | 711.4 | 729.8 | 759.6 |
Numerical data
The following are the details of the technical indicators and moving averages that were collected to generate this technical analysis:
| RSI (14): | 35.70 | |
| MACD (12,26,9): | -13.9000 | |
| Directional Movement: | -23.4 | |
| AROON (14): | 42.9 | |
| DEMA (21): | 640.4 | |
| Parabolic SAR (0,02-0,02-0,2): | 631.1 | |
| Elder Ray (13): | -5.5 | |
| Super Trend (3,10): | 664.8 | |
| Zig ZAG (10): | 646.6 | |
| VORTEX (21): | 0.9000 | |
| Stochastique (14,3,5): | 60.10 | |
| TEMA (21): | 640.7 | |
| Williams %R (14): | -55.20 | |
| Chande Momentum Oscillator (20): | 7.8 | |
| Repulse (5,40,3): | -0.4000 | |
| ROCnROLL: | 2 | |
| TRIX (15,9): | -0.4000 | |
| Courbe Coppock: | 0.60 |
| MA7: | 706.1 | |
| MA20: | 714.5 | |
| MA50: | 685.6 | |
| MA100: | 688.4 | |
| MAexp7: | 650.1 | |
| MAexp20: | 660.4 | |
| MAexp50: | 685.8 | |
| MAexp100: | 701.9 | |
| Price / MA7: | +1.53% | |
| Price / MA20: | +0.34% | |
| Price / MA50: | +4.57% | |
| Price / MA100: | +4.14% | |
| Price / MAexp7: | +10.26% | |
| Price / MAexp20: | +8.54% | |
| Price / MAexp50: | +4.52% | |
| Price / MAexp100: | +2.12% |
News
The latest news and videos published on ASML HOLDING at the time of the analysis were as follows:
- 01/29/2025 - 06:00 ASML reports €28.3 billion total net sales and €7.6 billion net income in 2024
- 01/15/2025 - 01:48 SHAREHOLDER ALERT: Pomerantz Law Firm Reminds Shareholders with Losses on their Investment in ASML Holding NV of Class Action Lawsuit and Upcoming Deadlines - ASML
- 01/13/2025 - 16:02 FINAL DEADLINE ALERT: Faruqi & Faruqi, LLP Investigates Claims on Behalf of Investors of ASML Holding
- 01/13/2025 - 10:45 Class Action Filed Against ASML Holding N.V. (ASML) Seeking Recovery for Investors - Contact The Gross Law Firm
- 01/10/2025 - 23:50 ASML Holding N.V. (ASML) Investors Who Lost Money Have Opportunity to Lead Securities Fraud Lawsuit
About author
Online


Add a comment
Comments
0 comments on the analysis ASML HOLDING - 1H