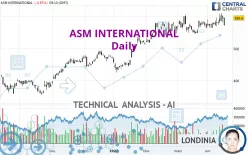
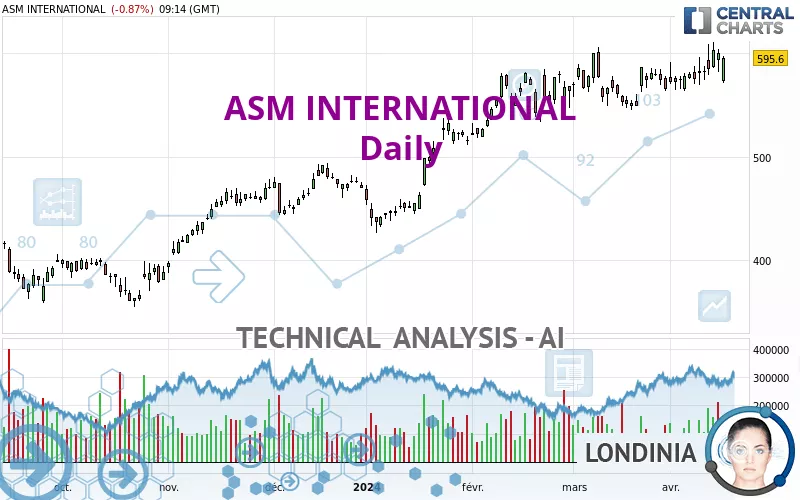
ASM INTERNATIONAL - Daily - Technical analysis published on 04/17/2024 (GMT)
- 139
- 0
Click here for a new analysis!
- Timeframe : Daily
- - Analysis generated on
- Status : INVALID
Summary of the analysis

Additional analysis
Quotes
The ASM INTERNATIONAL rating is 595.6 EUR. On the day, this instrument lost -0.87% with the lowest point at 571.0 EUR and the highest point at 597.4 EUR. The deviation from the price is +4.31% for the low point and -0.30% for the high point.The Central Gaps scanner detects a bearish gap which is a sign that the sellers have taken the lead in the very short term.
Opening Gap DOWN
Type : Bearish
Timeframe : Openning
A study of price movements over other periods shows the following variations:
New HIGH record (5 years)
Type : Bullish
Timeframe : Weekly
Near a new HIGH record (1 year)
Type : Bullish
Timeframe : Weekly
Near a new HIGH record (1st january)
Type : Bullish
Timeframe : Weekly
Near a new LOW record (1 month)
Type : Bearish
Timeframe : Weekly
Technical
Technical analysis of ASM INTERNATIONAL in Daily shows a strongly overall bullish trend. 92.86% of the signals given by moving averages are bullish. This strongly bullish trend is supported by the strong bullish signals given by short-term moving averages. The Central Indicators market scanner currently does not detect any result that concerns moving averages.
The probability of a further increase is high given the direction of the technical indicators.
Central Indicators, the detector scanner for these technical indicators has recently detected several signals:
Parabolic SAR indicator bearish reversal
Type : Bearish
Timeframe : Daily
Price is back over the pivot point
Type : Bullish
Timeframe : Weekly
No signals are given by Central Patterns, a market scanner specialised in chart patterns, resistances and supports.
The Central Candlesticks scanner, specialised in Japanese candlesticks, did not identify any signals.
| S3 | S2 | S1 | Price | R1 | |
|---|---|---|---|---|---|
| ProTrendLines | 427.8 | 457.3 | 549.1 | 595.6 | 600.2 |
| Change (%) | -28.17% | -23.22% | -7.81% | - | +0.77% |
| Change | -167.8 | -138.3 | -46.5 | - | +4.6 |
| Level | Major | Minor | Major | - | Major |
Attention could also be paid to pivot points to set price objectives:
| Pivot points | S3 | S2 | S1 | PP | R1 | R2 | R3 |
|---|---|---|---|---|---|---|---|
| Standard | 565.3 | 573.7 | 587.3 | 595.7 | 609.3 | 617.7 | 631.3 |
| Camarilla | 594.8 | 596.8 | 598.8 | 600.8 | 602.8 | 604.8 | 606.9 |
| Woodie | 567.8 | 575.0 | 589.8 | 597.0 | 611.8 | 619.0 | 633.8 |
| Fibonacci | 573.7 | 582.1 | 587.3 | 595.7 | 604.1 | 609.3 | 617.7 |
| Pivot points | S3 | S2 | S1 | PP | R1 | R2 | R3 |
|---|---|---|---|---|---|---|---|
| Standard | 526.1 | 547.5 | 566.1 | 587.5 | 606.1 | 627.5 | 646.1 |
| Camarilla | 573.6 | 577.3 | 580.9 | 584.6 | 588.3 | 591.9 | 595.6 |
| Woodie | 524.6 | 546.8 | 564.6 | 586.8 | 604.6 | 626.8 | 644.6 |
| Fibonacci | 547.5 | 562.8 | 572.3 | 587.5 | 602.8 | 612.3 | 627.5 |
| Pivot points | S3 | S2 | S1 | PP | R1 | R2 | R3 |
|---|---|---|---|---|---|---|---|
| Standard | 477.4 | 511.2 | 538.5 | 572.3 | 599.6 | 633.4 | 660.7 |
| Camarilla | 549.1 | 554.7 | 560.3 | 565.9 | 571.5 | 577.1 | 582.7 |
| Woodie | 474.3 | 509.6 | 535.4 | 570.7 | 596.5 | 631.8 | 657.6 |
| Fibonacci | 511.2 | 534.5 | 548.9 | 572.3 | 595.6 | 610.0 | 633.4 |
Numerical data
The following is the status of the technical indicators and moving averages at the time of publication of this technical analysis:
| RSI (14): | 60.30 | |
| MACD (12,26,9): | 8.8000 | |
| Directional Movement: | 9.1 | |
| AROON (14): | 42.8 | |
| DEMA (21): | 591.8 | |
| Parabolic SAR (0,02-0,02-0,2): | 611.0 | |
| Elder Ray (13): | -1.0 | |
| Super Trend (3,10): | 541.0 | |
| Zig ZAG (10): | 595.0 | |
| VORTEX (21): | 1.0000 | |
| Stochastique (14,3,5): | 76.30 | |
| TEMA (21): | 592.5 | |
| Williams %R (14): | -33.50 | |
| Chande Momentum Oscillator (20): | 29.1 | |
| Repulse (5,40,3): | 7.0000 | |
| ROCnROLL: | 1 | |
| TRIX (15,9): | 0.2000 | |
| Courbe Coppock: | 6.80 |
| MA7: | 589.4 | |
| MA20: | 578.1 | |
| MA50: | 569.7 | |
| MA100: | 522.9 | |
| MAexp7: | 591.2 | |
| MAexp20: | 580.8 | |
| MAexp50: | 561.7 | |
| MAexp100: | 528.4 | |
| Price / MA7: | +1.05% | |
| Price / MA20: | +3.03% | |
| Price / MA50: | +4.55% | |
| Price / MA100: | +13.90% | |
| Price / MAexp7: | +0.74% | |
| Price / MAexp20: | +2.55% | |
| Price / MAexp50: | +6.04% | |
| Price / MAexp100: | +12.72% |
News
Don't forget to follow the news on ASM INTERNATIONAL. At the time of publication of this analysis, the latest news was as follows:
- ASM International N.V. publishes Annual Report 2023
- ASM nominates Martin van den Brink to Supervisory Board
- ASM reports fourth quarter 2023
- Benjamin Loh to retire, Hichem M’Saad to succeed him as new CEO
- ASM nominates Tania Micki to Supervisory Board
About author
Online


Add a comment
Comments
0 comments on the analysis ASM INTERNATIONAL - Daily