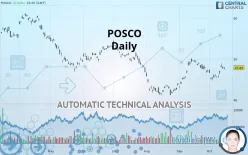
POSCO HLD. - Daily - Technical analysis published on 10/15/2019 (GMT)
- 218
- 0
- Who voted?
Click here for a new analysis!
- Timeframe : Daily
- - Analysis generated on
- Status : INVALID

Summary of the analysis

Additional analysis
Quotes
The POSCO price is 47.85 USD. On the day, this instrument gained +0.34% with the lowest point at 47.44 USD and the highest point at 47.98 USD. The deviation from the price is +0.86% for the low point and -0.27% for the high point.A bullish opening was detected by the Central Gaps scanner. Buyers are trying to impose a bullish momentum in the very short term.
Bullish opening
Type : Bullish
Timeframe : Openning
So that you have an overall view of the price change, here is a table showing the variations over several periods:
Near a new HIGH record (1 month)
Type : Bullish
Timeframe : Weekly
Technical
Technical analysis of POSCO in Daily shows an overall slightly bullish trend. 57.14% of the signals given by moving averages are bullish. The overall trend remains fragile, as do the slightly bullish signals given by short-term moving averages. The Central Indicators market scanner is currently detecting a bearish signal that could impact this trend:
Bearish price crossover with Moving Average 100
Type : Bearish
Timeframe : Daily
In fact, according to the parameters integrated into the Central Analyzer system, 14 technical indicators out of 18 analysed are currently bullish. Caution: the Central Indicators scanner currently detects an excess:
Williams %R indicator is overbought : over -20
Type : Neutral
Timeframe : Daily
MACD crosses UP its Moving Average
Type : Bullish
Timeframe : Daily
Price is back over the pivot point
Type : Bullish
Timeframe : Weekly
Price is back under the pivot point
Type : Bearish
Timeframe : Daily
Momentum indicator is back under 0
Type : Bearish
Timeframe : Daily
The analysis of the price chart with Central Patterns scanners does not return any result.
For a small setback in the very short term, the Central Candlesticks scanner currently notes the presence of this bearish pattern in Japanese candlesticks:
Black evening star
Type : Bearish
Timeframe : Daily
| S3 | S2 | S1 | Price | R1 | R2 | R3 | |
|---|---|---|---|---|---|---|---|
| ProTrendLines | 42.87 | 45.14 | 47.46 | 47.85 | 50.22 | 55.03 | 58.36 |
| Change (%) | -10.41% | -5.66% | -0.82% | - | +4.95% | +15.01% | +21.96% |
| Change | -4.98 | -2.71 | -0.39 | - | +2.37 | +7.18 | +10.51 |
| Level | Major | Major | Major | - | Major | Intermediate | Minor |
Attention could also be paid to pivot points to set price objectives:
| Pivot points | S3 | S2 | S1 | PP | R1 | R2 | R3 |
|---|---|---|---|---|---|---|---|
| Standard | 46.91 | 47.28 | 47.48 | 47.85 | 48.05 | 48.42 | 48.62 |
| Camarilla | 47.53 | 47.59 | 47.64 | 47.69 | 47.74 | 47.80 | 47.85 |
| Woodie | 46.84 | 47.24 | 47.41 | 47.81 | 47.98 | 48.38 | 48.55 |
| Fibonacci | 47.28 | 47.49 | 47.63 | 47.85 | 48.06 | 48.20 | 48.42 |
| Pivot points | S3 | S2 | S1 | PP | R1 | R2 | R3 |
|---|---|---|---|---|---|---|---|
| Standard | 42.87 | 44.16 | 46.25 | 47.54 | 49.63 | 50.92 | 53.01 |
| Camarilla | 47.40 | 47.71 | 48.02 | 48.33 | 48.64 | 48.95 | 49.26 |
| Woodie | 43.26 | 44.36 | 46.64 | 47.74 | 50.02 | 51.12 | 53.40 |
| Fibonacci | 44.16 | 45.45 | 46.25 | 47.54 | 48.83 | 49.63 | 50.92 |
| Pivot points | S3 | S2 | S1 | PP | R1 | R2 | R3 |
|---|---|---|---|---|---|---|---|
| Standard | 35.80 | 39.31 | 43.23 | 46.74 | 50.66 | 54.17 | 58.09 |
| Camarilla | 45.12 | 45.80 | 46.48 | 47.16 | 47.84 | 48.52 | 49.20 |
| Woodie | 36.02 | 39.41 | 43.45 | 46.84 | 50.88 | 54.27 | 58.31 |
| Fibonacci | 39.31 | 42.15 | 43.90 | 46.74 | 49.58 | 51.33 | 54.17 |
Numerical data
The following is the status of technical indicators and moving averages registered at the time this technical analysis was created:
| RSI (14): | 56.57 | |
| MACD (12,26,9): | 0.2200 | |
| Directional Movement: | 10.50 | |
| AROON (14): | 42.85 | |
| DEMA (21): | 47.23 | |
| Parabolic SAR (0,02-0,02-0,2): | 45.11 | |
| Elder Ray (13): | 0.69 | |
| Super Trend (3,10): | 45.43 | |
| Zig ZAG (10): | 47.90 | |
| VORTEX (21): | 0.8300 | |
| Stochastique (14,3,5): | 78.70 | |
| TEMA (21): | 47.26 | |
| Williams %R (14): | -23.41 | |
| Chande Momentum Oscillator (20): | 1.17 | |
| Repulse (5,40,3): | 0.4900 | |
| ROCnROLL: | 1 | |
| TRIX (15,9): | 0.0700 | |
| Courbe Coppock: | 5.06 |
| MA7: | 46.86 | |
| MA20: | 47.20 | |
| MA50: | 45.40 | |
| MA100: | 47.89 | |
| MAexp7: | 47.22 | |
| MAexp20: | 46.92 | |
| MAexp50: | 46.87 | |
| MAexp100: | 48.22 | |
| Price / MA7: | +2.11% | |
| Price / MA20: | +1.38% | |
| Price / MA50: | +5.40% | |
| Price / MA100: | -0.08% | |
| Price / MAexp7: | +1.33% | |
| Price / MAexp20: | +1.98% | |
| Price / MAexp50: | +2.09% | |
| Price / MAexp100: | -0.77% |
News
The latest news and videos published on POSCO at the time of the analysis were as follows:
- POSCO Files Its Annual Report on Form 20-F
-
 India, S. Korea Hope For Early Commencement Of POSCO Steel Plant Project
About author

Online


Add a comment
Comments
0 comments on the analysis POSCO HLD. - Daily