POLARIS INC. - Daily - Technical analysis published on 12/10/2019 (GMT)
- 334
- 0
- Who voted?
Click here for a new analysis!
- Timeframe : Daily
- - Analysis generated on
- Status : TARGET REACHED

Summary of the analysis

Additional analysis
Quotes
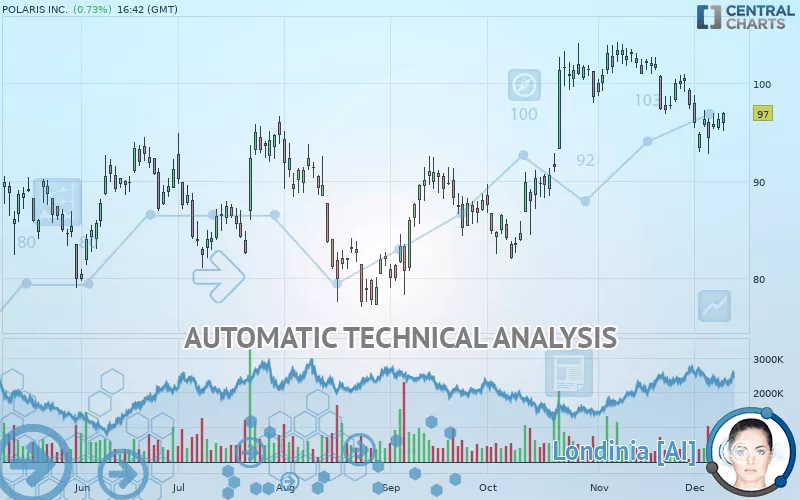
POLARIS INC. rating 97.00 USD. The price has increased by +0.73% since the last closing and was between 95.14 USD and 97.06 USD. This implies that the price is at +1.96% from its lowest and at -0.06% from its highest.A bearish opening was detected by the Central Gaps scanner. Sellers are trying to impose a bearish trend in the very short term.
Bearish opening
Type : Bearish
Timeframe : Openning
Here is a more detailed summary of the historical variations registered by POLARIS INC.:
Near a new LOW record (1 month)
Type : Bearish
Timeframe : Weekly
Technical
Technical analysis of this Daily chart of POLARIS INC. indicates that the overall trend is bullish. The signals given by moving averages are 71.43% bullish. This bullish trend could slow down given the neutral signals currently being given by short-term moving averages. An assessment of moving averages reveals several bullish signals that could impact this trend:
Bullish trend reversal : adaptative moving average 50
Type : Bullish
Timeframe : Daily
Bullish price crossover with adaptative moving average 50
Type : Bullish
Timeframe : Daily
In fact, of the 18 technical indicators analysed by Central Analyzer, 7 are bullish, 6 are neutral and 5 are bearish. Other results related to technical indicators were also found by the Central Indicators scanner:
Price is back over the pivot point
Type : Bullish
Timeframe : Daily
Price is back under the pivot point
Type : Bearish
Timeframe : Weekly
No signals are given by Central Patterns, a market scanner specialised in chart patterns, resistances and supports.
For a small rebound in the very short term, the Central Candlesticks scanner currently notes the presence of this bullish pattern in Japanese candlesticks:
Bullish engulfing lines
Type : Bullish
Timeframe : Daily
| S3 | S2 | S1 | Price | R1 | R2 | R3 | |
|---|---|---|---|---|---|---|---|
| ProTrendLines | 85.16 | 90.92 | 95.02 | 97.00 | 97.32 | 101.69 | 112.59 |
| Change (%) | -12.21% | -6.27% | -2.04% | - | +0.33% | +4.84% | +16.07% |
| Change | -11.84 | -6.08 | -1.98 | - | +0.32 | +4.69 | +15.59 |
| Level | Minor | Minor | Major | - | Major | Major | Minor |
Attention could also be paid to pivot points to set price objectives:
| Pivot points | S3 | S2 | S1 | PP | R1 | R2 | R3 |
|---|---|---|---|---|---|---|---|
| Standard | 93.56 | 94.37 | 95.33 | 96.14 | 97.10 | 97.91 | 98.87 |
| Camarilla | 95.81 | 95.98 | 96.14 | 96.30 | 96.46 | 96.62 | 96.79 |
| Woodie | 93.65 | 94.41 | 95.42 | 96.18 | 97.19 | 97.95 | 98.96 |
| Fibonacci | 94.37 | 95.04 | 95.46 | 96.14 | 96.81 | 97.23 | 97.91 |
| Pivot points | S3 | S2 | S1 | PP | R1 | R2 | R3 |
|---|---|---|---|---|---|---|---|
| Standard | 86.53 | 89.63 | 92.57 | 95.67 | 98.61 | 101.71 | 104.65 |
| Camarilla | 93.84 | 94.39 | 94.95 | 95.50 | 96.05 | 96.61 | 97.16 |
| Woodie | 86.44 | 89.59 | 92.48 | 95.63 | 98.52 | 101.67 | 104.56 |
| Fibonacci | 89.63 | 91.94 | 93.37 | 95.67 | 97.98 | 99.41 | 101.71 |
| Pivot points | S3 | S2 | S1 | PP | R1 | R2 | R3 |
|---|---|---|---|---|---|---|---|
| Standard | 87.40 | 91.81 | 94.79 | 99.20 | 102.18 | 106.59 | 109.57 |
| Camarilla | 95.73 | 96.41 | 97.08 | 97.76 | 98.44 | 99.12 | 99.79 |
| Woodie | 86.68 | 91.45 | 94.07 | 98.84 | 101.46 | 106.23 | 108.85 |
| Fibonacci | 91.81 | 94.63 | 96.38 | 99.20 | 102.02 | 103.77 | 106.59 |
Numerical data
The following are the details of the technical indicators and moving averages that were collected to generate this technical analysis:
| RSI (14): | 49.03 | |
| MACD (12,26,9): | -0.3800 | |
| Directional Movement: | -10.57 | |
| AROON (14): | -78.57 | |
| DEMA (21): | 97.30 | |
| Parabolic SAR (0,02-0,02-0,2): | 92.74 | |
| Elder Ray (13): | -0.90 | |
| Super Trend (3,10): | 101.00 | |
| Zig ZAG (10): | 96.89 | |
| VORTEX (21): | 0.8100 | |
| Stochastique (14,3,5): | 41.12 | |
| TEMA (21): | 95.44 | |
| Williams %R (14): | -47.20 | |
| Chande Momentum Oscillator (20): | 0.02 | |
| Repulse (5,40,3): | 1.2100 | |
| ROCnROLL: | -1 | |
| TRIX (15,9): | 0.0200 | |
| Courbe Coppock: | 8.37 |
| MA7: | 95.70 | |
| MA20: | 98.28 | |
| MA50: | 95.56 | |
| MA100: | 90.82 | |
| MAexp7: | 96.32 | |
| MAexp20: | 97.35 | |
| MAexp50: | 95.65 | |
| MAexp100: | 92.72 | |
| Price / MA7: | +1.36% | |
| Price / MA20: | -1.30% | |
| Price / MA50: | +1.51% | |
| Price / MA100: | +6.80% | |
| Price / MAexp7: | +0.71% | |
| Price / MAexp20: | -0.36% | |
| Price / MAexp50: | +1.41% | |
| Price / MAexp100: | +4.62% |
News
Don"t forget to follow the news on POLARIS INC.. At the time of publication of this analysis, the latest news was as follows:
- Polaris Announces Changes to Senior Leadership Team
- Polaris Assembles Elite Rodeo Athletes to Inaugurate Team RANGER Ahead of 2019 Wrangler National Finals Rodeo
- Polaris Divests a Majority of its Shareholding in Jetpak
- Polaris Slingshot Is Offering 350,000 Reasons to "Treat Yourself" This Holiday Season
- Synchrony and Polaris Extend Consumer Financing Partnership
About author

Online


Add a comment
Comments
0 comments on the analysis POLARIS INC. - Daily