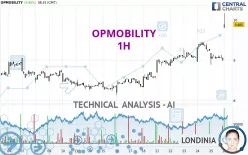
OPMOBILITY - 1H - Technical analysis published on 10/28/2024 (GMT)
- 113
- 0
Click here for a new analysis!
- Timeframe : 1H
- - Analysis generated on
- Status : INVALID

Summary of the analysis

Additional analysis
Quotes
The OPMOBILITY price is 9.885 EUR. The price registered an increase of +9.96% on the session with the lowest point at 9.805 EUR and the highest point at 10.170 EUR. The deviation from the price is +0.82% for the low point and -2.80% for the high point.The Central Gaps scanner detects a bullish gap which is a sign that buyers have taken the lead in the very short term.
Opening Gap UP
Type : Bullish
Timeframe : Openning
Here is a more detailed summary of the historical variations registered by OPMOBILITY:
Near a new HIGH record (1 month)
Type : Bullish
Timeframe : Weekly
Technical
Technical analysis of OPMOBILITY in 1H shows a strongly overall bullish trend. 92.86% of the signals given by moving averages are bullish. This strongly bullish trend is supported by the strong bullish signals given by short-term moving averages. The Central Indicators scanner detects bullish signals on moving averages that could impact this trend:
Bullish price crossover with Moving Average 20
Type : Bullish
Timeframe : 1 hour
Bullish price crossover with Moving Average 50
Type : Bullish
Timeframe : 1 hour
Bullish price crossover with adaptative moving average 20
Type : Bullish
Timeframe : 1 hour
Bullish price crossover with adaptative moving average 50
Type : Bullish
Timeframe : 1 hour
In fact, 12 technical indicators on 18 studied are currently positioned bullish. Caution: the Central Indicators scanner currently detects an excess:
RSI indicator is overbought : over 70
Type : Neutral
Timeframe : 1 hour
CCI indicator is overbought : over 100
Type : Neutral
Timeframe : 1 hour
RSI indicator: bullish divergence
Type : Bullish
Timeframe : 1 hour
Pivot points : price is over resistance 2
Type : Neutral
Timeframe : Weekly
Pivot points : price is over resistance 3
Type : Neutral
Timeframe : 1 hour
MACD crosses UP its Moving Average
Type : Bullish
Timeframe : 1 hour
Parabolic SAR indicator bullish reversal
Type : Bullish
Timeframe : 1 hour
Aroon indicator bullish trend
Type : Bullish
Timeframe : 1 hour
SuperTrend indicator bullish reversal
Type : Bullish
Timeframe : 1 hour
MACD indicator is back over 0
Type : Bullish
Timeframe : 1 hour
Momentum indicator is back over 0
Type : Bullish
Timeframe : 1 hour
Williams %R indicator is back over -50
Type : Bullish
Timeframe : 1 hour
An analysis of the price chart with the Central Patterns scanner (detector of chart patterns and resistances and supports) shows a result that can have an impact on the price change:
Near support of channel
Type : Bullish
Timeframe : 1 hour
Central Candlesticks, the scanner specialised in Japanese candlesticks, detects these bullish signals that could support the hypothesis of a small rebound in the very short term:
White line without lower shadow
Type : Bullish
Timeframe : 1 hour
Long white line
Type : Bullish
Timeframe : 1 hour
| S3 | S2 | S1 | Price | R1 | R2 | R3 | |
|---|---|---|---|---|---|---|---|
| ProTrendLines | 9.260 | 9.445 | 9.560 | 9.885 | 10.193 | 11.041 | 12.190 |
| Change (%) | -6.32% | -4.45% | -3.29% | - | +3.12% | +11.69% | +23.32% |
| Change | -0.625 | -0.440 | -0.325 | - | +0.308 | +1.156 | +2.305 |
| Level | Minor | Intermediate | Major | - | Minor | Minor | Major |
Attention could also be paid to pivot points to set price objectives:
| Pivot points | S3 | S2 | S1 | PP | R1 | R2 | R3 |
|---|---|---|---|---|---|---|---|
| Standard | 8.562 | 8.723 | 8.857 | 9.018 | 9.152 | 9.313 | 9.447 |
| Camarilla | 8.909 | 8.936 | 8.963 | 8.990 | 9.017 | 9.044 | 9.071 |
| Woodie | 8.548 | 8.716 | 8.843 | 9.011 | 9.138 | 9.306 | 9.433 |
| Fibonacci | 8.723 | 8.836 | 8.906 | 9.018 | 9.131 | 9.201 | 9.313 |
| Pivot points | S3 | S2 | S1 | PP | R1 | R2 | R3 |
|---|---|---|---|---|---|---|---|
| Standard | 7.867 | 8.273 | 8.632 | 9.038 | 9.397 | 9.803 | 10.162 |
| Camarilla | 8.780 | 8.850 | 8.920 | 8.990 | 9.060 | 9.130 | 9.200 |
| Woodie | 7.843 | 8.261 | 8.608 | 9.026 | 9.373 | 9.791 | 10.138 |
| Fibonacci | 8.273 | 8.566 | 8.746 | 9.038 | 9.331 | 9.511 | 9.803 |
| Pivot points | S3 | S2 | S1 | PP | R1 | R2 | R3 |
|---|---|---|---|---|---|---|---|
| Standard | 6.423 | 7.087 | 8.028 | 8.692 | 9.633 | 10.297 | 11.238 |
| Camarilla | 8.529 | 8.676 | 8.823 | 8.970 | 9.117 | 9.264 | 9.411 |
| Woodie | 6.563 | 7.156 | 8.168 | 8.761 | 9.773 | 10.366 | 11.378 |
| Fibonacci | 7.087 | 7.700 | 8.079 | 8.692 | 9.305 | 9.684 | 10.297 |
Numerical data
The following is the status of the technical indicators and moving averages at the time of publication of this technical analysis:
| RSI (14): | 75.29 | |
| MACD (12,26,9): | 0.0530 | |
| Directional Movement: | 41.956 | |
| AROON (14): | 64.286 | |
| DEMA (21): | 9.262 | |
| Parabolic SAR (0,02-0,02-0,2): | 8.885 | |
| Elder Ray (13): | 0.771 | |
| Super Trend (3,10): | 9.391 | |
| Zig ZAG (10): | 9.875 | |
| VORTEX (21): | 0.9680 | |
| Stochastique (14,3,5): | 43.00 | |
| TEMA (21): | 9.241 | |
| Williams %R (14): | -22.57 | |
| Chande Momentum Oscillator (20): | 0.605 | |
| Repulse (5,40,3): | -1.9800 | |
| ROCnROLL: | 1 | |
| TRIX (15,9): | 0.0480 | |
| Courbe Coppock: | 2.39 |
| MA7: | 9.116 | |
| MA20: | 8.756 | |
| MA50: | 8.598 | |
| MA100: | 8.895 | |
| MAexp7: | 9.272 | |
| MAexp20: | 9.193 | |
| MAexp50: | 9.057 | |
| MAexp100: | 8.886 | |
| Price / MA7: | +8.44% | |
| Price / MA20: | +12.89% | |
| Price / MA50: | +14.97% | |
| Price / MA100: | +11.13% | |
| Price / MAexp7: | +6.61% | |
| Price / MAexp20: | +7.53% | |
| Price / MAexp50: | +9.14% | |
| Price / MAexp100: | +11.24% |
News
The latest news and videos published on OPMOBILITY at the time of the analysis were as follows:
About author
Online


Add a comment
Comments
0 comments on the analysis OPMOBILITY - 1H