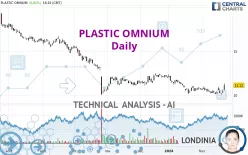
OPMOBILITY - Daily - Technical analysis published on 02/22/2024 (GMT)
- 135
- 0
Click here for a new analysis!
- Timeframe : Daily
- - Analysis generated on
- Status : LEVEL MAINTAINED

Summary of the analysis

Additional analysis
Quotes
The PLASTIC OMNIUM rating is 11.120 EUR. The price has increased by +6.82% since the last closing and was between 10.600 EUR and 11.380 EUR. This implies that the price is at +4.91% from its lowest and at -2.28% from its highest.Here is a more detailed summary of the historical variations registered by PLASTIC OMNIUM:
New LOW record (5 years)
Type : Bearish
Timeframe : Weekly
New HIGH record (1 month)
Type : Bullish
Timeframe : Weekly
The Central Volumes scanner detects abnormal volumes on the asset:
Abnormal volumes
Timeframe : 5 days
Technical
Technical analysis of PLASTIC OMNIUM in Daily shows an overall slightly bearish trend. Only 57.14% of the signals given by moving averages are bearish. This slightly bearish trend could quickly be reversed due to the strong bullish signals currently being given by short-term moving averages. The Central Indicators market scanner is currently detecting several bullish signals that could impact this trend:
Bullish price crossover with Moving Average 20
Type : Bullish
Timeframe : Daily
Bullish price crossover with Moving Average 50
Type : Bullish
Timeframe : Daily
Bullish price crossover with adaptative moving average 20
Type : Bullish
Timeframe : Daily
Bullish price crossover with adaptative moving average 100
Type : Bullish
Timeframe : Daily
An assessment of technical indicators shows a moderate bullish signal.
But beware of excesses. The Central Indicators scanner currently detects this:
CCI indicator is overbought : over 100
Type : Neutral
Timeframe : Daily
Williams %R indicator is overbought : over -20
Type : Neutral
Timeframe : Daily
Pivot points : price is over resistance 1
Type : Neutral
Timeframe : Weekly
Pivot points : price is over resistance 3
Type : Neutral
Timeframe : Daily
RSI indicator is back over 50
Type : Bullish
Timeframe : Daily
Parabolic SAR indicator bullish reversal
Type : Bullish
Timeframe : Daily
Aroon indicator bullish trend
Type : Bullish
Timeframe : Daily
SuperTrend indicator bullish reversal
Type : Bullish
Timeframe : Daily
Momentum indicator is back over 0
Type : Bullish
Timeframe : Daily
Central Patterns, the market scanner focusing on chart patterns, resistances and supports found these results:
Horizontal resistance is broken
Type : Bullish
Timeframe : Daily
Resistance of channel is broken
Type : Bullish
Timeframe : Daily
No result was found by the Central Candlesticks scanner on Japanese candlesticks.
| S3 | S2 | S1 | Price | R1 | R2 | R3 | |
|---|---|---|---|---|---|---|---|
| ProTrendLines | 3.384 | 6.216 | 10.130 | 11.120 | 11.210 | 12.820 | 15.606 |
| Change (%) | -69.57% | -44.10% | -8.90% | - | +0.81% | +15.29% | +40.34% |
| Change | -7.736 | -4.904 | -0.990 | - | +0.090 | +1.700 | +4.486 |
| Level | Intermediate | Major | Major | - | Minor | Major | Intermediate |
To determine price objectives, it is also possible to use the pivot points. Here is the price position in relation to pivot points:
| Pivot points | S3 | S2 | S1 | PP | R1 | R2 | R3 |
|---|---|---|---|---|---|---|---|
| Standard | 9.907 | 10.253 | 10.687 | 11.033 | 11.467 | 11.813 | 12.247 |
| Camarilla | 10.906 | 10.977 | 11.049 | 11.120 | 11.192 | 11.263 | 11.335 |
| Woodie | 9.950 | 10.275 | 10.730 | 11.055 | 11.510 | 11.835 | 12.290 |
| Fibonacci | 10.253 | 10.551 | 10.735 | 11.033 | 11.331 | 11.515 | 11.813 |
| Pivot points | S3 | S2 | S1 | PP | R1 | R2 | R3 |
|---|---|---|---|---|---|---|---|
| Standard | 9.270 | 9.680 | 10.140 | 10.550 | 11.010 | 11.420 | 11.880 |
| Camarilla | 10.361 | 10.441 | 10.520 | 10.600 | 10.680 | 10.760 | 10.839 |
| Woodie | 9.295 | 9.693 | 10.165 | 10.563 | 11.035 | 11.433 | 11.905 |
| Fibonacci | 9.680 | 10.012 | 10.218 | 10.550 | 10.882 | 11.088 | 11.420 |
| Pivot points | S3 | S2 | S1 | PP | R1 | R2 | R3 |
|---|---|---|---|---|---|---|---|
| Standard | 7.503 | 8.827 | 9.753 | 11.077 | 12.003 | 13.327 | 14.253 |
| Camarilla | 10.061 | 10.268 | 10.474 | 10.680 | 10.886 | 11.093 | 11.299 |
| Woodie | 7.305 | 8.728 | 9.555 | 10.978 | 11.805 | 13.228 | 14.055 |
| Fibonacci | 8.827 | 9.686 | 10.217 | 11.077 | 11.936 | 12.467 | 13.327 |
Numerical data
The following are the details of the technical indicators and moving averages that were collected to generate this technical analysis:
| RSI (14): | 58.17 | |
| MACD (12,26,9): | -0.1420 | |
| Directional Movement: | 15.673 | |
| AROON (14): | 14.286 | |
| DEMA (21): | 10.330 | |
| Parabolic SAR (0,02-0,02-0,2): | 9.990 | |
| Elder Ray (13): | 0.489 | |
| Super Trend (3,10): | 9.738 | |
| Zig ZAG (10): | 11.120 | |
| VORTEX (21): | 0.8820 | |
| Stochastique (14,3,5): | 45.81 | |
| TEMA (21): | 10.420 | |
| Williams %R (14): | -18.71 | |
| Chande Momentum Oscillator (20): | 0.450 | |
| Repulse (5,40,3): | 2.8040 | |
| ROCnROLL: | -1 | |
| TRIX (15,9): | -0.3030 | |
| Courbe Coppock: | 3.74 |
| MA7: | 10.420 | |
| MA20: | 10.518 | |
| MA50: | 11.115 | |
| MA100: | 11.697 | |
| MAexp7: | 10.528 | |
| MAexp20: | 10.568 | |
| MAexp50: | 11.018 | |
| MAexp100: | 11.916 | |
| Price / MA7: | +6.72% | |
| Price / MA20: | +5.72% | |
| Price / MA50: | +0.04% | |
| Price / MA100: | -4.93% | |
| Price / MAexp7: | +5.62% | |
| Price / MAexp20: | +5.22% | |
| Price / MAexp50: | +0.93% | |
| Price / MAexp100: | -6.68% |
News
The last news published on PLASTIC OMNIUM at the time of the generation of this analysis was as follows:
About author

Online


Add a comment
Comments
0 comments on the analysis OPMOBILITY - Daily