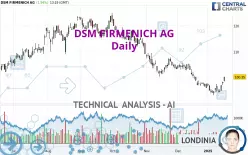
DSM FIRMENICH AG - Daily - Technical analysis published on 01/17/2025 (GMT)
- 94
- 0
Click here for a new analysis!
- Timeframe : Daily
- - Analysis generated on
- Status : TARGET REACHED

Summary of the analysis

Additional analysis
Quotes
The DSM FIRMENICH AG price is 100.35 EUR. On the day, this instrument gained +1.94% and was traded between 98.50 EUR and 100.35 EUR over the period. The price is currently at +1.88% from its lowest and 0% from its highest.A bullish gap was detected at the opening by the Central Gaps scanner. There are a lot of buyers and they have the upper hand in the very short term.
Opening Gap UP
Type : Bullish
Timeframe : Openning
So that you have an overall view of the price change, here is a table showing the variations over several periods:
New HIGH record (1st january)
Type : Bullish
Timeframe : Weekly
Near a new HIGH record (1 month)
Type : Bullish
Timeframe : Weekly
Technical
Technical analysis of DSM FIRMENICH AG in Daily shows an overall bearish trend. The signals given by moving averages are 71.43% bearish. This bearish trend could slow down given the neutral signals currently being given by short-term moving averages. An assessment of moving averages reveals a bullish signal that could impact this trend:
Bullish trend reversal : adaptative moving average 20
Type : Bullish
Timeframe : Daily
The probability of a further increase are moderate given the direction of the technical indicators.
Caution: the Central Indicators scanner currently detects an excess:
CCI indicator is overbought : over 100
Type : Neutral
Timeframe : Daily
Williams %R indicator is overbought : over -20
Type : Neutral
Timeframe : Daily
Pivot points : price is over resistance 2
Type : Neutral
Timeframe : Weekly
Pivot points : price is over resistance 3
Type : Neutral
Timeframe : Daily
SuperTrend indicator bullish reversal
Type : Bullish
Timeframe : Daily
Central Patterns, the market scanner focusing on chart patterns, resistances and supports found this result:
Horizontal resistance is broken
Type : Bullish
Timeframe : Daily
The presence of a bullish Japanese candlestick pattern detected by Central Candlesticks that could cause a very short term rebound was also detected:
Upside gap
Type : Bullish
Timeframe : Daily
| S2 | S1 | Price | R1 | R2 | R3 | |
|---|---|---|---|---|---|---|
| ProTrendLines | 94.02 | 98.25 | 100.35 | 105.03 | 108.27 | 118.09 |
| Change (%) | -6.31% | -2.09% | - | +4.66% | +7.89% | +17.68% |
| Change | -6.33 | -2.10 | - | +4.68 | +7.92 | +17.74 |
| Level | Intermediate | Major | - | Intermediate | Intermediate | Minor |
Pivot points can also be used to set your price objectives. Here is the price situation in relation to pivot points:
| Pivot points | S3 | S2 | S1 | PP | R1 | R2 | R3 |
|---|---|---|---|---|---|---|---|
| Standard | 96.37 | 96.79 | 97.61 | 98.03 | 98.85 | 99.27 | 100.09 |
| Camarilla | 98.10 | 98.21 | 98.33 | 98.44 | 98.55 | 98.67 | 98.78 |
| Woodie | 96.58 | 96.89 | 97.82 | 98.13 | 99.06 | 99.37 | 100.30 |
| Fibonacci | 96.79 | 97.26 | 97.55 | 98.03 | 98.50 | 98.79 | 99.27 |
| Pivot points | S3 | S2 | S1 | PP | R1 | R2 | R3 |
|---|---|---|---|---|---|---|---|
| Standard | 88.57 | 90.95 | 93.03 | 95.41 | 97.49 | 99.87 | 101.95 |
| Camarilla | 93.89 | 94.30 | 94.71 | 95.12 | 95.53 | 95.94 | 96.35 |
| Woodie | 88.43 | 90.88 | 92.89 | 95.34 | 97.35 | 99.80 | 101.81 |
| Fibonacci | 90.95 | 92.65 | 93.70 | 95.41 | 97.11 | 98.16 | 99.87 |
| Pivot points | S3 | S2 | S1 | PP | R1 | R2 | R3 |
|---|---|---|---|---|---|---|---|
| Standard | 84.41 | 90.25 | 93.98 | 99.82 | 103.55 | 109.39 | 113.12 |
| Camarilla | 95.09 | 95.97 | 96.84 | 97.72 | 98.60 | 99.48 | 100.35 |
| Woodie | 83.37 | 89.72 | 92.94 | 99.29 | 102.51 | 108.86 | 112.08 |
| Fibonacci | 90.25 | 93.90 | 96.16 | 99.82 | 103.47 | 105.73 | 109.39 |
Numerical data
The following is the status of technical indicators and moving averages registered at the time this technical analysis was created:
| RSI (14): | 56.25 | |
| MACD (12,26,9): | -1.3100 | |
| Directional Movement: | 9.07 | |
| AROON (14): | 50.00 | |
| DEMA (21): | 95.54 | |
| Parabolic SAR (0,02-0,02-0,2): | 94.26 | |
| Elder Ray (13): | 2.23 | |
| Super Trend (3,10): | 94.08 | |
| Zig ZAG (10): | 100.30 | |
| VORTEX (21): | 0.9100 | |
| Stochastique (14,3,5): | 92.50 | |
| TEMA (21): | 96.38 | |
| Williams %R (14): | 0.00 | |
| Chande Momentum Oscillator (20): | 2.33 | |
| Repulse (5,40,3): | 3.3200 | |
| ROCnROLL: | -1 | |
| TRIX (15,9): | -0.3000 | |
| Courbe Coppock: | 2.39 |
| MA7: | 96.66 | |
| MA20: | 96.74 | |
| MA50: | 101.06 | |
| MA100: | 109.17 | |
| MAexp7: | 97.31 | |
| MAexp20: | 97.62 | |
| MAexp50: | 101.37 | |
| MAexp100: | 105.00 | |
| Price / MA7: | +3.82% | |
| Price / MA20: | +3.73% | |
| Price / MA50: | -0.70% | |
| Price / MA100: | -8.08% | |
| Price / MAexp7: | +3.12% | |
| Price / MAexp20: | +2.80% | |
| Price / MAexp50: | -1.01% | |
| Price / MAexp100: | -4.43% |
News
Don't forget to follow the news on DSM FIRMENICH AG. At the time of publication of this analysis, the latest news was as follows:
- dsm-firmenich Q3 2024 trading update
- dsm-firmenich completes the sale of yeast extract business to Lesaffre
- dsm-firmenich concludes new €1.8 billion Revolving Credit Facility
- DSM shareholders can voluntarily transfer their shares to dsm-firmenich before July 2, 2024, 17:45 hours CEST
- dsm-firmenich completes the divestiture of its Jiangshan Vitamin C plant in China
About author
Online


Add a comment
Comments
0 comments on the analysis DSM FIRMENICH AG - Daily