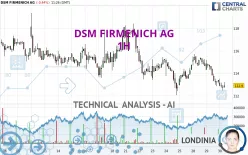
DSM FIRMENICH AG - 1H - Technical analysis published on 10/30/2024 (GMT)
- 132
- 0
Click here for a new analysis!
- Timeframe : 1H
- - Analysis generated on
- Status : TARGET REACHED

Summary of the analysis

Additional analysis
Quotes
The DSM FIRMENICH AG price is 112.90 EUR. On the day, this instrument lost -0.44% and was between 112.45 EUR and 113.50 EUR. This implies that the price is at +0.40% from its lowest and at -0.53% from its highest.So that you have an overall view of the price change, here is a table showing the variations over several periods:
Near a new LOW record (1 month)
Type : Bearish
Timeframe : Weekly
Technical
A technical analysis in 1H of this DSM FIRMENICH AG chart shows a sharp bearish trend. 92.86% of the signals given by moving averages are bearish. This strongly bearish trend is supported by the strong bearish signals given by short-term moving averages. The Central Indicators scanner detects a bearish signal on moving averages that could impact this trend:
Moving Average bearish crossovers : MA20 & MA50
Type : Bearish
Timeframe : 1 hour
An assessment of technical indicators shows a bearish signal.
But beware of excesses. The Central Indicators scanner currently detects this:
RSI indicator: bullish divergence
Type : Bullish
Timeframe : 1 hour
Williams %R indicator is oversold : under -80
Type : Neutral
Timeframe : 1 hour
The Central Patterns scanner, which studies chart patterns, resistances and supports, has identified this signal:
Near support of channel
Type : Bullish
Timeframe : 1 hour
There is also a Japanese candlestick pattern detected by Central Candlesticks that could mark the end of the current short-term trend:
Doji
Type : Neutral
Timeframe : 1 hour
| S3 | S2 | S1 | Price | R1 | R2 | R3 | |
|---|---|---|---|---|---|---|---|
| ProTrendLines | 104.41 | 108.27 | 112.05 | 112.90 | 113.57 | 115.71 | 118.09 |
| Change (%) | -7.52% | -4.10% | -0.75% | - | +0.59% | +2.49% | +4.60% |
| Change | -8.49 | -4.63 | -0.85 | - | +0.67 | +2.81 | +5.19 |
| Level | Minor | Minor | Intermediate | - | Intermediate | Intermediate | Intermediate |
Pivot points can also be used to set your price objectives. Here is the price situation in relation to pivot points:
| Pivot points | S3 | S2 | S1 | PP | R1 | R2 | R3 |
|---|---|---|---|---|---|---|---|
| Standard | 110.08 | 111.47 | 112.43 | 113.82 | 114.78 | 116.17 | 117.13 |
| Camarilla | 112.75 | 112.97 | 113.19 | 113.40 | 113.62 | 113.83 | 114.05 |
| Woodie | 109.88 | 111.36 | 112.23 | 113.71 | 114.58 | 116.06 | 116.93 |
| Fibonacci | 111.47 | 112.36 | 112.92 | 113.82 | 114.71 | 115.27 | 116.17 |
| Pivot points | S3 | S2 | S1 | PP | R1 | R2 | R3 |
|---|---|---|---|---|---|---|---|
| Standard | 105.38 | 108.72 | 111.73 | 115.07 | 118.08 | 121.42 | 124.43 |
| Camarilla | 113.00 | 113.59 | 114.17 | 114.75 | 115.33 | 115.91 | 116.50 |
| Woodie | 105.23 | 108.64 | 111.58 | 114.99 | 117.93 | 121.34 | 124.28 |
| Fibonacci | 108.72 | 111.14 | 112.64 | 115.07 | 117.49 | 118.99 | 121.42 |
| Pivot points | S3 | S2 | S1 | PP | R1 | R2 | R3 |
|---|---|---|---|---|---|---|---|
| Standard | 109.45 | 112.35 | 118.00 | 120.90 | 126.55 | 129.45 | 135.10 |
| Camarilla | 121.30 | 122.08 | 122.87 | 123.65 | 124.43 | 125.22 | 126.00 |
| Woodie | 110.83 | 113.04 | 119.38 | 121.59 | 127.93 | 130.14 | 136.48 |
| Fibonacci | 112.35 | 115.62 | 117.63 | 120.90 | 124.17 | 126.18 | 129.45 |
Numerical data
The following are the details of the technical indicators and moving averages that were collected to generate this technical analysis:
| RSI (14): | 33.69 | |
| MACD (12,26,9): | -0.4400 | |
| Directional Movement: | -16.42 | |
| AROON (14): | -85.72 | |
| DEMA (21): | 113.22 | |
| Parabolic SAR (0,02-0,02-0,2): | 114.11 | |
| Elder Ray (13): | -0.49 | |
| Super Trend (3,10): | 114.27 | |
| Zig ZAG (10): | 112.85 | |
| VORTEX (21): | 0.8200 | |
| Stochastique (14,3,5): | 9.62 | |
| TEMA (21): | 112.89 | |
| Williams %R (14): | -89.29 | |
| Chande Momentum Oscillator (20): | -2.10 | |
| Repulse (5,40,3): | -0.3500 | |
| ROCnROLL: | 2 | |
| TRIX (15,9): | -0.0300 | |
| Courbe Coppock: | 3.33 |
| MA7: | 113.97 | |
| MA20: | 115.55 | |
| MA50: | 118.15 | |
| MA100: | 114.30 | |
| MAexp7: | 113.09 | |
| MAexp20: | 113.71 | |
| MAexp50: | 114.23 | |
| MAexp100: | 114.84 | |
| Price / MA7: | -0.94% | |
| Price / MA20: | -2.29% | |
| Price / MA50: | -4.44% | |
| Price / MA100: | -1.22% | |
| Price / MAexp7: | -0.17% | |
| Price / MAexp20: | -0.71% | |
| Price / MAexp50: | -1.16% | |
| Price / MAexp100: | -1.69% |
News
The last news published on DSM FIRMENICH AG at the time of the generation of this analysis was as follows:
- dsm-firmenich completes the sale of yeast extract business to Lesaffre
- dsm-firmenich concludes new €1.8 billion Revolving Credit Facility
- DSM shareholders can voluntarily transfer their shares to dsm-firmenich before July 2, 2024, 17:45 hours CEST
- dsm-firmenich completes the divestiture of its Jiangshan Vitamin C plant in China
- dsm-firmenich reports full year 2023 results
About author
Online


Add a comment
Comments
0 comments on the analysis DSM FIRMENICH AG - 1H