PENN ENTERTAINMENT INC. - Daily - Technical analysis published on 02/13/2022 (GMT)
- 271
- 0
- Timeframe : Daily
- - Analysis generated on
- Status : NEUTRAL

Summary of the analysis

Additional analysis
Quotes
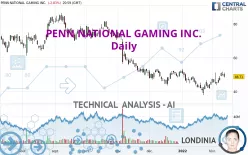
PENN NATIONAL GAMING INC. rating 48.71 USD. The price registered a decrease of -2.83% on the session and was traded between 48.24 USD and 51.13 USD over the period. The price is currently at +0.97% from its lowest and -4.73% from its highest.A bullish opening was detected by the Central Gaps scanner. Buyers are trying to impose a bullish momentum in the very short term.
Bullish opening
Type : Bullish
Timeframe : Openning
Here is a more detailed summary of the historical variations registered by PENN NATIONAL GAMING INC.:
Near a new HIGH record (1st january)
Type : Bullish
Timeframe : Weekly
Near a new HIGH record (1 month)
Type : Bullish
Timeframe : Weekly
Technical
Technical analysis of this Daily chart of PENN NATIONAL GAMING INC. indicates that the overall trend is slightly bearish. Only 60.71% of the signals given by moving averages are bearish. This slightly bearish trend could turn neutral or reverse given the slightly bullish signals currently being given by short-term moving averages. The Central Indicators scanner does not detect any result on moving averages that would impact this trend.
In fact, 14 technical indicators on 18 studied are currently bullish. Caution: the Central Indicators scanner currently detects an excess:
CCI indicator is overbought : over 100
Type : Neutral
Timeframe : Daily
Pivot points : price is under support 1
Type : Neutral
Timeframe : Daily
Ichimoku : price is under the cloud
Type : Bearish
Timeframe : Daily
Price is back over the pivot point
Type : Bullish
Timeframe : Weekly
No signals are given by Central Patterns, a market scanner specialised in chart patterns, resistances and supports.
Central Candlesticks, the scanner specialised in Japanese candlesticks, detects a bearish signal that could support the hypothesis of a small drop in the very short term:
Bearish engulfing lines
Type : Bearish
Timeframe : Daily
| S3 | S2 | S1 | Price | R1 | R2 | R3 | |
|---|---|---|---|---|---|---|---|
| ProTrendLines | 36.93 | 40.92 | 44.76 | 48.71 | 53.03 | 65.21 | 71.55 |
| Change (%) | -24.18% | -15.99% | -8.11% | - | +8.87% | +33.87% | +46.89% |
| Change | -11.78 | -7.79 | -3.95 | - | +4.32 | +16.50 | +22.84 |
| Level | Major | Intermediate | Minor | - | Intermediate | Intermediate | Minor |
To determine price objectives, it is also possible to use the pivot points. Here is the price position in relation to pivot points:
| Pivot points | S3 | S2 | S1 | PP | R1 | R2 | R3 |
|---|---|---|---|---|---|---|---|
| Standard | 44.70 | 46.47 | 47.59 | 49.36 | 50.48 | 52.25 | 53.37 |
| Camarilla | 47.92 | 48.18 | 48.45 | 48.71 | 48.98 | 49.24 | 49.51 |
| Woodie | 44.38 | 46.31 | 47.27 | 49.20 | 50.16 | 52.09 | 53.05 |
| Fibonacci | 46.47 | 47.57 | 48.26 | 49.36 | 50.46 | 51.15 | 52.25 |
| Pivot points | S3 | S2 | S1 | PP | R1 | R2 | R3 |
|---|---|---|---|---|---|---|---|
| Standard | 38.76 | 41.95 | 45.33 | 48.52 | 51.90 | 55.09 | 58.47 |
| Camarilla | 46.90 | 47.51 | 48.11 | 48.71 | 49.31 | 49.92 | 50.52 |
| Woodie | 38.86 | 42.00 | 45.43 | 48.57 | 52.00 | 55.14 | 58.57 |
| Fibonacci | 41.95 | 44.46 | 46.01 | 48.52 | 51.03 | 52.58 | 55.09 |
| Pivot points | S3 | S2 | S1 | PP | R1 | R2 | R3 |
|---|---|---|---|---|---|---|---|
| Standard | 22.19 | 29.98 | 37.79 | 45.58 | 53.39 | 61.18 | 68.99 |
| Camarilla | 41.32 | 42.75 | 44.18 | 45.61 | 47.04 | 48.47 | 49.90 |
| Woodie | 22.21 | 29.99 | 37.81 | 45.59 | 53.41 | 61.19 | 69.01 |
| Fibonacci | 29.98 | 35.94 | 39.62 | 45.58 | 51.54 | 55.22 | 61.18 |
Numerical data
The following are the details of the technical indicators and moving averages that were collected to generate this technical analysis:
| RSI (14): | 55.48 | |
| MACD (12,26,9): | 0.4000 | |
| Directional Movement: | 13.82 | |
| AROON (14): | 92.86 | |
| DEMA (21): | 46.76 | |
| Parabolic SAR (0,02-0,02-0,2): | 43.10 | |
| Elder Ray (13): | 2.55 | |
| Super Trend (3,10): | 41.97 | |
| Zig ZAG (10): | 48.71 | |
| VORTEX (21): | 1.0000 | |
| Stochastique (14,3,5): | 85.72 | |
| TEMA (21): | 48.68 | |
| Williams %R (14): | -28.63 | |
| Chande Momentum Oscillator (20): | 5.25 | |
| Repulse (5,40,3): | -2.1300 | |
| ROCnROLL: | -1 | |
| TRIX (15,9): | -0.1600 | |
| Courbe Coppock: | 24.58 |
| MA7: | 47.84 | |
| MA20: | 45.09 | |
| MA50: | 47.40 | |
| MA100: | 57.34 | |
| MAexp7: | 48.19 | |
| MAexp20: | 46.76 | |
| MAexp50: | 49.09 | |
| MAexp100: | 55.81 | |
| Price / MA7: | +1.82% | |
| Price / MA20: | +8.03% | |
| Price / MA50: | +2.76% | |
| Price / MA100: | -15.05% | |
| Price / MAexp7: | +1.08% | |
| Price / MAexp20: | +4.17% | |
| Price / MAexp50: | -0.77% | |
| Price / MAexp100: | -12.72% |
News
Don't forget to follow the news on PENN NATIONAL GAMING INC.. At the time of publication of this analysis, the latest news was as follows:
- theScore Bet Receives Certificate of Registration as an Internet Gaming Operator From the Alcohol and Gaming Commission of Ontario
- Penn National Gaming Reports Fourth Quarter Revenues of $1.6 Billion, Net Income of $44.8 Million, Adjusted EBITDAR of $480.5 Million, and Adjusted EBITDA of $369.0 Million
- Penn National Gaming Issues Statement Following Announcement That Ontario’s Regulated Sports Betting and iGaming Market Will Open to Private Operators on April 4, 2022
- Penn National Gaming Approved to Offer Mobile and Online Barstool Sportsbook in Louisiana
- Penn National Gaming to Report Fourth Quarter Results and Host Conference Call and Webcast on February 3
About author

Online


Add a comment
Comments
0 comments on the analysis PENN ENTERTAINMENT INC. - Daily