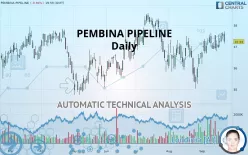
PEMBINA PIPELINE - Daily - Technical analysis published on 09/25/2019 (GMT)
- 248
- 0
- Who voted?
Click here for a new analysis!
- Timeframe : Daily
- - Analysis generated on
- Status : INVALID

Summary of the analysis

Additional analysis
Quotes
The PEMBINA PIPELINE rating is 37.23 USD. On the day, this instrument lost -0.96% and was between 37.14 USD and 37.71 USD. This implies that the price is at +0.24% from its lowest and at -1.27% from its highest.So that you have an overall view of the price change, here is a table showing the variations over several periods:
Near a new HIGH record (5 years)
Type : Bullish
Timeframe : Weekly
Near a new HIGH record (1 year)
Type : Bullish
Timeframe : Weekly
Near a new HIGH record (1st january)
Type : Bullish
Timeframe : Weekly
Technical
Technical analysis of this Daily chart of PEMBINA PIPELINE indicates that the overall trend is strongly bullish. 85.71% of the signals given by moving averages are bullish. This strongly bullish trend is supported by the strong bullish signals given by short-term moving averages. The Central Indicators market scanner is currently detecting a bullish signal that could impact this trend:
Moving Average bullish crossovers : MA20 & MA50
Type : Bullish
Timeframe : Daily
An assessment of technical indicators shows a strong bullish signal.
Caution: the Central Indicators scanner currently detects an excess:
CCI indicator: bearish divergence
Type : Bearish
Timeframe : Daily
MACD indicator: bearish divergence
Type : Bearish
Timeframe : Daily
Williams %R indicator is overbought : over -20
Type : Neutral
Timeframe : Daily
Pivot points : price is under support 1
Type : Neutral
Timeframe : Daily
Price is back over the pivot point
Type : Bullish
Timeframe : Daily
No signals are given by Central Patterns, a market scanner specialised in chart patterns, resistances and supports.
No result was found by the Central Candlesticks scanner on Japanese candlesticks.
| S3 | S2 | S1 | Price | R1 | |
|---|---|---|---|---|---|
| ProTrendLines | 33.12 | 34.93 | 36.73 | 37.23 | 38.45 |
| Change (%) | -11.04% | -6.18% | -1.34% | - | +3.28% |
| Change | -4.11 | -2.30 | -0.50 | - | +1.22 |
| Level | Minor | Major | Major | - | Major |
Pivot points can also be used to set your price objectives. Here is the price situation in relation to pivot points:
| Pivot points | S3 | S2 | S1 | PP | R1 | R2 | R3 |
|---|---|---|---|---|---|---|---|
| Standard | 37.06 | 37.19 | 37.39 | 37.53 | 37.73 | 37.86 | 38.06 |
| Camarilla | 37.50 | 37.53 | 37.56 | 37.59 | 37.62 | 37.65 | 37.68 |
| Woodie | 37.09 | 37.21 | 37.42 | 37.54 | 37.76 | 37.88 | 38.09 |
| Fibonacci | 37.19 | 37.32 | 37.40 | 37.53 | 37.66 | 37.74 | 37.86 |
| Pivot points | S3 | S2 | S1 | PP | R1 | R2 | R3 |
|---|---|---|---|---|---|---|---|
| Standard | 35.96 | 36.30 | 36.81 | 37.15 | 37.67 | 38.01 | 38.53 |
| Camarilla | 37.10 | 37.17 | 37.25 | 37.33 | 37.41 | 37.49 | 37.57 |
| Woodie | 36.05 | 36.34 | 36.90 | 37.20 | 37.76 | 38.05 | 38.62 |
| Fibonacci | 36.30 | 36.62 | 36.82 | 37.15 | 37.48 | 37.68 | 38.01 |
| Pivot points | S3 | S2 | S1 | PP | R1 | R2 | R3 |
|---|---|---|---|---|---|---|---|
| Standard | 32.93 | 33.91 | 35.22 | 36.20 | 37.51 | 38.49 | 39.79 |
| Camarilla | 35.89 | 36.10 | 36.31 | 36.52 | 36.73 | 36.94 | 37.15 |
| Woodie | 33.09 | 33.99 | 35.38 | 36.28 | 37.67 | 38.57 | 39.96 |
| Fibonacci | 33.91 | 34.78 | 35.32 | 36.20 | 37.07 | 37.61 | 38.49 |
Numerical data
The following are the details of the technical indicators and moving averages that were collected to generate this technical analysis:
| RSI (14): | 56.73 | |
| MACD (12,26,9): | 0.2200 | |
| Directional Movement: | 8.10 | |
| AROON (14): | 85.71 | |
| DEMA (21): | 37.15 | |
| Parabolic SAR (0,02-0,02-0,2): | 36.96 | |
| Elder Ray (13): | 0.40 | |
| Super Trend (3,10): | 36.01 | |
| Zig ZAG (10): | 37.23 | |
| VORTEX (21): | 1.1300 | |
| Stochastique (14,3,5): | 80.87 | |
| TEMA (21): | 37.33 | |
| Williams %R (14): | -40.12 | |
| Chande Momentum Oscillator (20): | 0.36 | |
| Repulse (5,40,3): | -0.7800 | |
| ROCnROLL: | 1 | |
| TRIX (15,9): | 0.0600 | |
| Courbe Coppock: | 4.06 |
| MA7: | 37.12 | |
| MA20: | 36.78 | |
| MA50: | 36.68 | |
| MA100: | 36.26 | |
| MAexp7: | 37.18 | |
| MAexp20: | 36.90 | |
| MAexp50: | 36.66 | |
| MAexp100: | 36.28 | |
| Price / MA7: | +0.30% | |
| Price / MA20: | +1.22% | |
| Price / MA50: | +1.50% | |
| Price / MA100: | +2.68% | |
| Price / MAexp7: | +0.13% | |
| Price / MAexp20: | +0.89% | |
| Price / MAexp50: | +1.55% | |
| Price / MAexp100: | +2.62% |
News
Don"t forget to follow the news on PEMBINA PIPELINE. At the time of publication of this analysis, the latest news was as follows:
- Pembina Pipeline Corporation Declares February 2018 Common Share Dividend and Fourth Quarter/ Annual 2017 Results Conference Call and Webcast
- Pembina Pipeline Corporation Declares February 2018 Common Share Dividend and Fourth Quarter/ Annual 2017 Results Conference Call and Webcast
- Pembina Pipeline Corporation Declares Common Share Dividend for January and Quarterly Preferred Share Dividends
- Pembina Pipeline Corporation Declares Common Share Dividend for January and Quarterly Preferred Share Dividends
- Pembina Pipeline Corporation Announces Senior Management Appointments
About author

Online


Add a comment
Comments
0 comments on the analysis PEMBINA PIPELINE - Daily