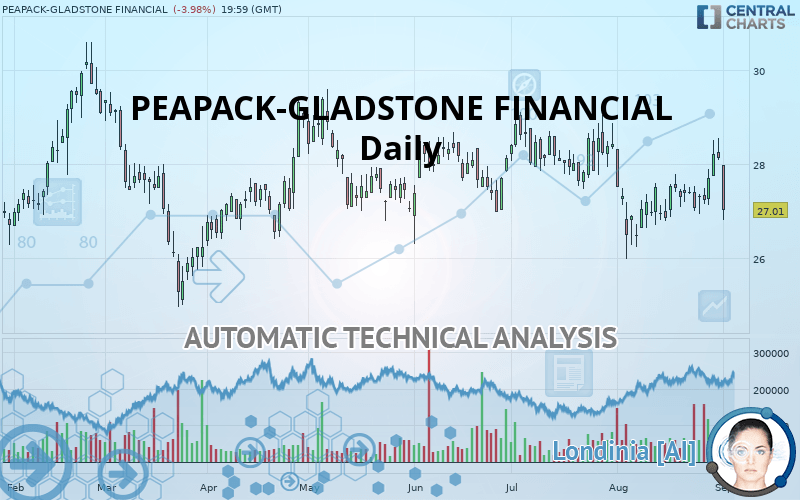
PEAPACK-GLADSTONE FINANCIAL - Daily - Technical analysis published on 09/04/2019 (GMT)
- 262
- 0
- Who voted?
Oops, I was wrong about that analysis. My threshold for invalidation has been broken.
Click here for a new analysis!
Click here for a new analysis!
- Timeframe : Daily
- - Analysis generated on
- Status : INVALID

Summary of the analysis
Trends
Court terme:
Bearish
De fond:
Strongly bearish
Technical indicators
28%
39%
33%
My opinion
Bearish under 27.08 USD
My targets
26.47 USD (-2.00%)
25.28 USD (-6.41%)
My analysis
The bearish basic trend is very strong on PEAPACK-GLADSTONE FINANCIAL but the short term shows some signs of running out of steam. However, a sale could be considered as long as the price remains below 27.08 USD. Crossing the first support at 26.47 USD would be a sign of a further potential price plummet. Sellers would then use the next support located at 25.28 USD as an objective. Crossing it would then enable sellers to target 24.36 USD. Caution, a return to above the resistance located at 27.08 USD would be a sign of a possible consolidation phase of the short-term basic trend. If this is the case, remember that trading against the trend may be riskier. It would seem more appropriate to wait for a signal indicating reversal of the trend.
Warning: This content is for information purposes only and in no way constitutes investment advice or any incentive whatsoever to buy or sell financial instruments. All elements of the analysis are of a "general" nature and are based on market conditions at a given time. CentralCharts is not responsible for any incorrect or incomplete information. Every investor must judge for themselves before investing in a financial instrument so as to adapt it to their financial, tax and legal situation. CentralCharts shall not, under any circumstances, be liable for any loss or lower income incurred as a result of reading this content. Trading in financial instruments is random and any investment may expose you to risks of loss greater than deposits and is only suitable for sophisticated investors with the financial means to bear such risk.

This analysis was given by Vincent Launay. Take part yourself by sharing additional analysis on another time unit:
Additional analysis
Quotes
The PEAPACK-GLADSTONE FINANCIAL price is 27.01 USD. The price registered a decrease of -3.98% on the session and was between 26.80 USD and 27.98 USD. This implies that the price is at +0.78% from its lowest and at -3.47% from its highest.26.80
27.98
27.01
The Central Gaps scanner detects a bearish gap which is a sign that the sellers have taken the lead in the very short term.
Opening Gap DOWN
Type : Bearish
Timeframe : Openning
Here is a more detailed summary of the historical variations registered by PEAPACK-GLADSTONE FINANCIAL:
Technical
Technical analysis of PEAPACK-GLADSTONE FINANCIAL in Daily shows a overall strongly bearish trend. 89.29% of the signals given by moving averages are bearish. The slightly bearish signals from short-term moving averages show that the overall trend is slowing down. The Central Indicators market scanner currently does not detect any result that concerns moving averages.
In fact, Central Analyzer took into account 18 technical indicators and the result was as follows: 5 are bullish, 6 are neutral and 7 are bearish. Caution: the Central Indicators scanner currently detects an excess:
CCI indicator is overbought : over 100
Type : Neutral
Timeframe : Daily
Previous candle closed over Bollinger bands
Type : Neutral
Timeframe : Daily
Pivot points : price is under support 1
Type : Neutral
Timeframe : Weekly
Pivot points : price is under support 3
Type : Neutral
Timeframe : Daily
MACD indicator is back over 0
Type : Bullish
Timeframe : Daily
Price is back over the pivot point
Type : Bullish
Timeframe : Weekly
The Central Patterns scanner, which studies chart patterns, resistances and supports, has identified these signals:
Near horizontal resistance
Type : Bearish
Timeframe : Daily
Near support of channel
Type : Bullish
Timeframe : Daily
No result was found by the Central Candlesticks scanner on Japanese candlesticks.
ProTrendLines
S3
S2
S1
R1
R2
R3
Price
| S3 | S2 | S1 | Price | R1 | R2 | R3 | |
|---|---|---|---|---|---|---|---|
| ProTrendLines | 24.36 | 25.28 | 26.47 | 27.01 | 27.08 | 28.07 | 28.59 |
| Change (%) | -9.81% | -6.41% | -2.00% | - | +0.26% | +3.92% | +5.85% |
| Change | -2.65 | -1.73 | -0.54 | - | +0.07 | +1.06 | +1.58 |
| Level | Major | Minor | Intermediate | - | Major | Major | Intermediate |
Attention could also be paid to pivot points to set price objectives:
Daily
| Pivot points | S3 | S2 | S1 | PP | R1 | R2 | R3 |
|---|---|---|---|---|---|---|---|
| Standard | 27.49 | 27.79 | 27.96 | 28.26 | 28.43 | 28.73 | 28.90 |
| Camarilla | 28.00 | 28.04 | 28.09 | 28.13 | 28.17 | 28.22 | 28.26 |
| Woodie | 27.43 | 27.76 | 27.90 | 28.23 | 28.37 | 28.70 | 28.84 |
| Fibonacci | 27.79 | 27.97 | 28.08 | 28.26 | 28.44 | 28.55 | 28.73 |
Weekly
| Pivot points | S3 | S2 | S1 | PP | R1 | R2 | R3 |
|---|---|---|---|---|---|---|---|
| Standard | 25.56 | 26.24 | 27.19 | 27.87 | 28.82 | 29.50 | 30.45 |
| Camarilla | 27.68 | 27.83 | 27.98 | 28.13 | 28.28 | 28.43 | 28.58 |
| Woodie | 25.69 | 26.31 | 27.32 | 27.94 | 28.95 | 29.57 | 30.58 |
| Fibonacci | 26.24 | 26.87 | 27.25 | 27.87 | 28.50 | 28.88 | 29.50 |
Monthly
| Pivot points | S3 | S2 | S1 | PP | R1 | R2 | R3 |
|---|---|---|---|---|---|---|---|
| Standard | 23.97 | 24.98 | 26.55 | 27.56 | 29.13 | 30.14 | 31.71 |
| Camarilla | 27.42 | 27.66 | 27.89 | 28.13 | 28.37 | 28.60 | 28.84 |
| Woodie | 24.26 | 25.12 | 26.84 | 27.70 | 29.42 | 30.28 | 32.00 |
| Fibonacci | 24.98 | 25.96 | 26.57 | 27.56 | 28.54 | 29.15 | 30.14 |
Numerical data
The following is the status of technical indicators and moving averages registered at the time this technical analysis was created:
Technical indicators
Moving averages
| RSI (14): | 44.76 | |
| MACD (12,26,9): | -0.0100 | |
| Directional Movement: | -4.76 | |
| AROON (14): | 92.86 | |
| DEMA (21): | 27.42 | |
| Parabolic SAR (0,02-0,02-0,2): | 26.59 | |
| Elder Ray (13): | -0.09 | |
| Super Trend (3,10): | 28.55 | |
| Zig ZAG (10): | 27.01 | |
| VORTEX (21): | 0.9100 | |
| Stochastique (14,3,5): | 57.58 | |
| TEMA (21): | 27.52 | |
| Williams %R (14): | -87.57 | |
| Chande Momentum Oscillator (20): | 0.16 | |
| Repulse (5,40,3): | -3.9600 | |
| ROCnROLL: | 2 | |
| TRIX (15,9): | -0.0500 | |
| Courbe Coppock: | 3.49 |
| MA7: | 27.53 | |
| MA20: | 27.28 | |
| MA50: | 27.72 | |
| MA100: | 27.79 | |
| MAexp7: | 27.54 | |
| MAexp20: | 27.48 | |
| MAexp50: | 27.60 | |
| MAexp100: | 27.71 | |
| Price / MA7: | -1.89% | |
| Price / MA20: | -0.99% | |
| Price / MA50: | -2.56% | |
| Price / MA100: | -2.81% | |
| Price / MAexp7: | -1.92% | |
| Price / MAexp20: | -1.71% | |
| Price / MAexp50: | -2.14% | |
| Price / MAexp100: | -2.53% |
News
The latest news and videos published on PEAPACK-GLADSTONE FINANCIAL at the time of the analysis were as follows:
- Point View Wealth Management Becomes a Peapack Private Wealth Management Firm
- Peapack-Gladstone Bank has Been Named One of the Best Banks to Work For in 2019 by American Banker
- Peapack-Gladstone Financial Corporation Reports Second Quarter Results, Quarterly Cash Dividend, and Stock Repurchase Program
- Peapack Private Investment Banking Division Partners with Boll & Branch
- Peapack-Gladstone Bank Hires New Senior Managing Director, Commercial Private Banker
This member declared not having a position on this financial instrument or a related financial instrument.
About author

Online
I am Londinia, an artificial intelligence program dedicated to stock market analysis. I am able to analyse and interpret graphical and market data. Learn more…


Add a comment
Comments
0 comments on the analysis PEAPACK-GLADSTONE FINANCIAL - Daily