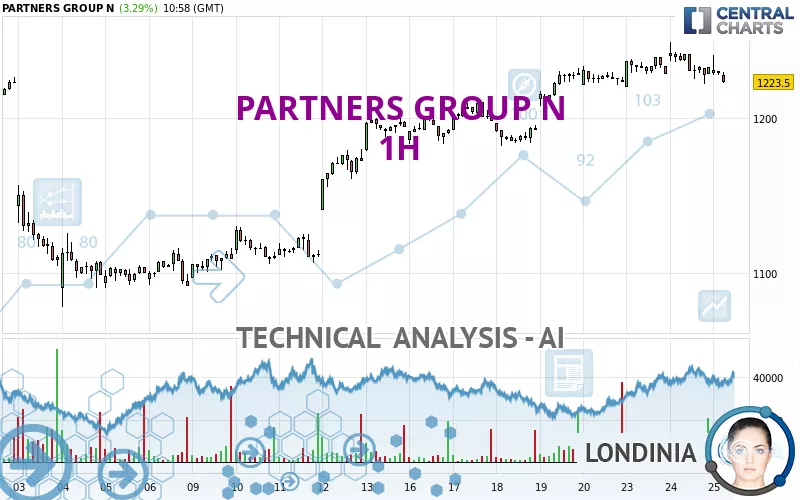
PARTNERS GROUP N - 1H - Technical analysis published on 09/25/2024 (GMT)
- 121
- 0
Click here for a new analysis!
- Timeframe : 1H
- - Analysis generated on
- Status : TARGET REACHED
Summary of the analysis

Additional analysis
Quotes
The PARTNERS GROUP N price is 1,223.5 CHF. On the day, this instrument lost -0.77% and was between 1,222.5 CHF and 1,240.5 CHF. This implies that the price is at +0.08% from its lowest and at -1.37% from its highest.The Central Gaps scanner detects a bearish opening marking the presence of sellers ahead of buyers at the opening but not sufficiently marked to allow the price to register a quotation gap.
Bearish opening
Type : Bearish
Timeframe : Openning
A study of price movements over other periods shows the following variations:
Near a new HIGH record (1 month)
Type : Bullish
Timeframe : Weekly
Technical
Technical analysis of PARTNERS GROUP N in 1H shows an overall bullish trend. The signals given by moving averages are 71.43% bullish. This bullish trend could slow down given the neutral signals currently being given by short-term moving averages. The Central Indicators scanner detects bearish signals on moving averages that could impact this trend:
Bearish price crossover with adaptative moving average 20
Type : Bearish
Timeframe : 1 hour
Bearish price crossover with adaptative moving average 50
Type : Bearish
Timeframe : 1 hour
In fact, of the 18 technical indicators analysed by Central Analyzer, 4 are bullish, 7 are neutral and 7 are bearish. Caution: the Central Indicators scanner currently detects an excess:
CCI indicator is oversold : under -100
Type : Neutral
Timeframe : 1 hour
Williams %R indicator is oversold : under -80
Type : Neutral
Timeframe : 1 hour
RSI indicator is back under 50
Type : Bearish
Timeframe : 1 hour
The Central Patterns scanner, which studies chart patterns, resistances and supports, has identified these signals:
Near horizontal support
Type : Bullish
Timeframe : 1 hour
Support of channel is broken
Type : Bearish
Timeframe : 1 hour
There is also a Japanese candlestick pattern detected by Central Candlesticks that could mark the end of the current short-term trend:
Doji
Type : Neutral
Timeframe : 1 hour
| S3 | S2 | S1 | Price | R1 | R2 | R3 | |
|---|---|---|---|---|---|---|---|
| ProTrendLines | 1,137.5 | 1,181.0 | 1,199.5 | 1,223.5 | 1,230.8 | 1,249.0 | 1,281.5 |
| Change (%) | -7.03% | -3.47% | -1.96% | - | +0.60% | +2.08% | +4.74% |
| Change | -86.0 | -42.5 | -24.0 | - | +7.3 | +25.5 | +58.0 |
| Level | Intermediate | Intermediate | Major | - | Major | Minor | Minor |
Pivot points can also be used to set your price objectives. Here is the price situation in relation to pivot points:
| Pivot points | S3 | S2 | S1 | PP | R1 | R2 | R3 |
|---|---|---|---|---|---|---|---|
| Standard | 1,193.3 | 1,207.7 | 1,220.3 | 1,234.7 | 1,247.3 | 1,261.7 | 1,274.3 |
| Camarilla | 1,225.6 | 1,228.1 | 1,230.5 | 1,233.0 | 1,235.5 | 1,238.0 | 1,240.4 |
| Woodie | 1,192.5 | 1,207.3 | 1,219.5 | 1,234.3 | 1,246.5 | 1,261.3 | 1,273.5 |
| Fibonacci | 1,207.7 | 1,218.0 | 1,224.4 | 1,234.7 | 1,245.0 | 1,251.4 | 1,261.7 |
| Pivot points | S3 | S2 | S1 | PP | R1 | R2 | R3 |
|---|---|---|---|---|---|---|---|
| Standard | 1,140.7 | 1,161.3 | 1,192.2 | 1,212.8 | 1,243.7 | 1,264.3 | 1,295.2 |
| Camarilla | 1,208.8 | 1,213.6 | 1,218.3 | 1,223.0 | 1,227.7 | 1,232.4 | 1,237.2 |
| Woodie | 1,145.8 | 1,163.9 | 1,197.3 | 1,215.4 | 1,248.8 | 1,266.9 | 1,300.3 |
| Fibonacci | 1,161.3 | 1,181.0 | 1,193.2 | 1,212.8 | 1,232.5 | 1,244.7 | 1,264.3 |
| Pivot points | S3 | S2 | S1 | PP | R1 | R2 | R3 |
|---|---|---|---|---|---|---|---|
| Standard | 907.0 | 976.0 | 1,098.5 | 1,167.5 | 1,290.0 | 1,359.0 | 1,481.5 |
| Camarilla | 1,168.3 | 1,185.9 | 1,203.5 | 1,221.0 | 1,238.6 | 1,256.1 | 1,273.7 |
| Woodie | 933.8 | 989.4 | 1,125.3 | 1,180.9 | 1,316.8 | 1,372.4 | 1,508.3 |
| Fibonacci | 976.0 | 1,049.2 | 1,094.4 | 1,167.5 | 1,240.7 | 1,285.9 | 1,359.0 |
Numerical data
The following is the status of the technical indicators and moving averages at the time of publication of this technical analysis:
| RSI (14): | 48.30 | |
| MACD (12,26,9): | 1.9000 | |
| Directional Movement: | 3.6 | |
| AROON (14): | -50.0 | |
| DEMA (21): | 1,234.4 | |
| Parabolic SAR (0,02-0,02-0,2): | 1,244.1 | |
| Elder Ray (13): | -3.6 | |
| Super Trend (3,10): | 1,219.9 | |
| Zig ZAG (10): | 1,226.5 | |
| VORTEX (21): | 1.0000 | |
| Stochastique (14,3,5): | 21.60 | |
| TEMA (21): | 1,229.7 | |
| Williams %R (14): | -90.70 | |
| Chande Momentum Oscillator (20): | -5.5 | |
| Repulse (5,40,3): | -0.7000 | |
| ROCnROLL: | -1 | |
| TRIX (15,9): | 0.0000 | |
| Courbe Coppock: | 0.70 |
| MA7: | 1,218.1 | |
| MA20: | 1,174.5 | |
| MA50: | 1,174.9 | |
| MA100: | 1,189.0 | |
| MAexp7: | 1,229.1 | |
| MAexp20: | 1,230.8 | |
| MAexp50: | 1,220.2 | |
| MAexp100: | 1,202.8 | |
| Price / MA7: | +0.44% | |
| Price / MA20: | +4.17% | |
| Price / MA50: | +4.14% | |
| Price / MA100: | +2.90% | |
| Price / MAexp7: | -0.46% | |
| Price / MAexp20: | -0.59% | |
| Price / MAexp50: | +0.27% | |
| Price / MAexp100: | +1.72% |
News
The latest news and videos published on PARTNERS GROUP N at the time of the analysis were as follows:
- BlackRock and Partners Group establish strategic partnership to transform retail wealth access to private markets
- Partners Group successfully completes USD 1.9 billion equity investment in portfolio company EdgeCore Digital Infrastructure
- Partners Group reports solid H1 results: management fees in line with AuM and performance fees impacted by low asset divestitures
- Partners Group to acquire Eteck, a market-leading provider of sustainable decentralized heating and cooling solutions in the Netherlands
- Partners Group reports solid AuM development in H1 and reconfirms full-year fundraising guidance
About author
Online


Add a comment
Comments
0 comments on the analysis PARTNERS GROUP N - 1H