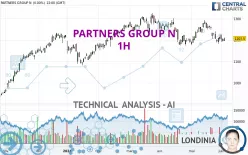
PARTNERS GROUP N - 1H - Technical analysis published on 06/06/2024 (GMT)
- 115
- 0
Click here for a new analysis!
- Timeframe : 1H
- - Analysis generated on
- Status : INVALID

Summary of the analysis

Additional analysis
Quotes
PARTNERS GROUP N rating 1,187.5 CHF. On the day, this instrument lost -1.66% and was traded between 1,187.5 CHF and 1,200.5 CHF over the period. The price is currently at 0% from its lowest and -1.08% from its highest.The Central Gaps scanner detects a bearish opening. A small advantage for sellers in the very short term.
Bearish opening
Type : Bearish
Timeframe : Openning
A study of price movements over other periods shows the following variations:
Near a new LOW record (1 month)
Type : Bearish
Timeframe : Weekly
Technical
Technical analysis of this 1H chart of PARTNERS GROUP N indicates that the overall trend is strongly bearish. The signals given by moving averages are 82.14% bearish. This strong bearish trend is confirmed by the strong signals currently being given by short-term moving averages. The Central Indicators scanner detects bearish signals on moving averages that could impact this trend:
Bearish price crossover with Moving Average 20
Type : Bearish
Timeframe : 1 hour
Bearish price crossover with Moving Average 50
Type : Bearish
Timeframe : 1 hour
Bearish price crossover with adaptative moving average 20
Type : Bearish
Timeframe : 1 hour
Bearish price crossover with adaptative moving average 50
Type : Bearish
Timeframe : 1 hour
In fact, only 7 technical indicators out of 18 studied are currently positioned bearish. Caution: the Central Indicators scanner currently detects an excess:
CCI indicator is oversold : under -100
Type : Neutral
Timeframe : 1 hour
Williams %R indicator is oversold : under -80
Type : Neutral
Timeframe : 1 hour
Pivot points : price is under support 1
Type : Neutral
Timeframe : 1 hour
RSI indicator is back under 50
Type : Bearish
Timeframe : 1 hour
Ichimoku : price is under the cloud
Type : Bearish
Timeframe : 1 hour
MACD indicator is back under 0
Type : Bearish
Timeframe : 1 hour
Price is back under the pivot point
Type : Bearish
Timeframe : Weekly
Momentum indicator is back under 0
Type : Bearish
Timeframe : 1 hour
Central Patterns, the market scanner focusing on chart patterns, resistances and supports found this result:
Near resistance of channel
Type : Bearish
Timeframe : 1 hour
The Central Candlesticks scanner which studies Japanese candlesticks did not detect anything.
| S3 | S2 | S1 | Price | R1 | R2 | R3 | |
|---|---|---|---|---|---|---|---|
| ProTrendLines | 1,048.5 | 1,094.0 | 1,181.0 | 1,187.5 | 1,193.6 | 1,208.8 | 1,230.5 |
| Change (%) | -11.71% | -7.87% | -0.55% | - | +0.51% | +1.79% | +3.62% |
| Change | -139.0 | -93.5 | -6.5 | - | +6.1 | +21.3 | +43.0 |
| Level | Intermediate | Intermediate | Major | - | Intermediate | Intermediate | Minor |
Pivot points can also be used to set your price objectives. Here is the price situation in relation to pivot points:
| Pivot points | S3 | S2 | S1 | PP | R1 | R2 | R3 |
|---|---|---|---|---|---|---|---|
| Standard | 1,181.3 | 1,188.2 | 1,197.8 | 1,204.7 | 1,214.3 | 1,221.2 | 1,230.8 |
| Camarilla | 1,203.0 | 1,204.5 | 1,206.0 | 1,207.5 | 1,209.0 | 1,210.5 | 1,212.0 |
| Woodie | 1,182.8 | 1,188.9 | 1,199.3 | 1,205.4 | 1,215.8 | 1,221.9 | 1,232.3 |
| Fibonacci | 1,188.2 | 1,194.5 | 1,198.4 | 1,204.7 | 1,211.0 | 1,214.9 | 1,221.2 |
| Pivot points | S3 | S2 | S1 | PP | R1 | R2 | R3 |
|---|---|---|---|---|---|---|---|
| Standard | 1,121.3 | 1,151.7 | 1,178.8 | 1,209.2 | 1,236.3 | 1,266.7 | 1,293.8 |
| Camarilla | 1,190.2 | 1,195.5 | 1,200.7 | 1,206.0 | 1,211.3 | 1,216.5 | 1,221.8 |
| Woodie | 1,119.8 | 1,150.9 | 1,177.3 | 1,208.4 | 1,234.8 | 1,265.9 | 1,292.3 |
| Fibonacci | 1,151.7 | 1,173.6 | 1,187.2 | 1,209.2 | 1,231.1 | 1,244.7 | 1,266.7 |
| Pivot points | S3 | S2 | S1 | PP | R1 | R2 | R3 |
|---|---|---|---|---|---|---|---|
| Standard | 1,040.8 | 1,108.7 | 1,157.3 | 1,225.2 | 1,273.8 | 1,341.7 | 1,390.3 |
| Camarilla | 1,174.0 | 1,184.6 | 1,195.3 | 1,206.0 | 1,216.7 | 1,227.4 | 1,238.0 |
| Woodie | 1,031.3 | 1,103.9 | 1,147.8 | 1,220.4 | 1,264.3 | 1,336.9 | 1,380.8 |
| Fibonacci | 1,108.7 | 1,153.2 | 1,180.7 | 1,225.2 | 1,269.7 | 1,297.2 | 1,341.7 |
Numerical data
The following is the status of the technical indicators and moving averages at the time of publication of this technical analysis:
| RSI (14): | 45.40 | |
| MACD (12,26,9): | -0.1000 | |
| Directional Movement: | -9.6 | |
| AROON (14): | 57.1 | |
| DEMA (21): | 1,202.4 | |
| Parabolic SAR (0,02-0,02-0,2): | 1,193.7 | |
| Elder Ray (13): | -5.3 | |
| Super Trend (3,10): | 1,212.6 | |
| Zig ZAG (10): | 1,197.5 | |
| VORTEX (21): | 1.0000 | |
| Stochastique (14,3,5): | 62.00 | |
| TEMA (21): | 1,203.6 | |
| Williams %R (14): | -80.60 | |
| Chande Momentum Oscillator (20): | -5.0 | |
| Repulse (5,40,3): | 0.0000 | |
| ROCnROLL: | 2 | |
| TRIX (15,9): | 0.0000 | |
| Courbe Coppock: | 0.10 |
| MA7: | 1,201.4 | |
| MA20: | 1,233.2 | |
| MA50: | 1,237.5 | |
| MA100: | 1,224.5 | |
| MAexp7: | 1,202.6 | |
| MAexp20: | 1,202.6 | |
| MAexp50: | 1,205.8 | |
| MAexp100: | 1,214.0 | |
| Price / MA7: | -1.16% | |
| Price / MA20: | -3.71% | |
| Price / MA50: | -4.04% | |
| Price / MA100: | -3.02% | |
| Price / MAexp7: | -1.26% | |
| Price / MAexp20: | -1.26% | |
| Price / MAexp50: | -1.52% | |
| Price / MAexp100: | -2.18% |
News
The last news published on PARTNERS GROUP N at the time of the generation of this analysis was as follows:
- Partners Group announces results of the 2024 Annual General Meeting of Shareholders
- Partners Group's USD AuM growth of 8% translated into stable profit of CHF 1 billion, impacted by foreign exchange effects; performance fees up 37%
- Partners Group adds private markets royalties to its investment platform
- Partners Group further strengthens its Real Estate business with three leadership appointments
- Partners Group reports AuM of USD 147 billion per end of 2023; increases guidance for gross client demand in 2024
About author
Online


Add a comment
Comments
0 comments on the analysis PARTNERS GROUP N - 1H