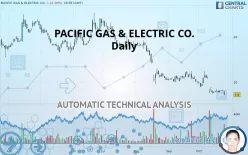
PACIFIC GAS & ELECTRIC CO. - Daily - Technical analysis published on 10/25/2019 (GMT)
- 250
- 0
- Who voted?
Click here for a new analysis!
- Timeframe : Daily
- - Analysis generated on
- Status : TARGET REACHED

Summary of the analysis

Additional analysis
Quotes
The PACIFIC GAS & ELECTRIC CO. price is 7.20 USD. On the day, this instrument lost -12.20% with the lowest point at 7.05 USD and the highest point at 7.90 USD. The deviation from the price is +2.13% for the low point and -8.86% for the high point.The Central Gaps scanner detects a bearish gap which is a sign that the sellers have taken the lead in the very short term.
Opening Gap DOWN
Type : Bearish
Timeframe : Openning
So that you have an overall view of the price change, here is a table showing the variations over several periods:
Technical
A technical analysis in Daily of this PACIFIC GAS & ELECTRIC CO. chart shows a sharp bearish trend. 92.86% of the signals given by moving averages are bearish. The overall trend is supported by the strong bearish signals from short-term moving averages. The Central Indicators scanner detects a bearish signal on moving averages that could impact this trend:
Moving Average bearish crossovers : AMA20 & AMA50
Type : Bearish
Timeframe : Daily
In fact, according to the parameters integrated into the Central Analyzer system, 13 technical indicators out of 18 analysed are currently bearish. Caution: the Central Indicators scanner currently detects an excess:
MACD indicator: bearish divergence
Type : Bearish
Timeframe : Daily
Williams %R indicator is oversold : under -80
Type : Neutral
Timeframe : Daily
Pivot points : price is under support 1
Type : Neutral
Timeframe : Weekly
Pivot points : price is under support 3
Type : Neutral
Timeframe : Daily
MACD crosses DOWN its Moving Average
Type : Bearish
Timeframe : Daily
Central Patterns, the scanner specializing in chart patterns, did not identify any signals.
No result was found by the Central Candlesticks scanner on Japanese candlesticks.
| S1 | Price | R1 | R2 | R3 | |
|---|---|---|---|---|---|
| ProTrendLines | 6.36 | 7.20 | 11.50 | 17.04 | 23.87 |
| Change (%) | -11.67% | - | +59.72% | +136.67% | +231.53% |
| Change | -0.84 | - | +4.30 | +9.84 | +16.67 |
| Level | Major | - | Minor | Intermediate | Intermediate |
Pivot points can also be used to set your price objectives. Here is the price situation in relation to pivot points:
| Pivot points | S3 | S2 | S1 | PP | R1 | R2 | R3 |
|---|---|---|---|---|---|---|---|
| Standard | 7.75 | 7.86 | 8.03 | 8.14 | 8.31 | 8.42 | 8.59 |
| Camarilla | 8.12 | 8.15 | 8.17 | 8.20 | 8.23 | 8.25 | 8.28 |
| Woodie | 7.78 | 7.88 | 8.06 | 8.16 | 8.34 | 8.44 | 8.62 |
| Fibonacci | 7.86 | 7.97 | 8.03 | 8.14 | 8.25 | 8.31 | 8.42 |
| Pivot points | S3 | S2 | S1 | PP | R1 | R2 | R3 |
|---|---|---|---|---|---|---|---|
| Standard | 6.33 | 6.87 | 7.31 | 7.85 | 8.29 | 8.83 | 9.27 |
| Camarilla | 7.49 | 7.58 | 7.67 | 7.76 | 7.85 | 7.94 | 8.03 |
| Woodie | 6.29 | 6.85 | 7.27 | 7.83 | 8.25 | 8.81 | 9.23 |
| Fibonacci | 6.87 | 7.24 | 7.47 | 7.85 | 8.22 | 8.45 | 8.83 |
| Pivot points | S3 | S2 | S1 | PP | R1 | R2 | R3 |
|---|---|---|---|---|---|---|---|
| Standard | 6.10 | 7.84 | 8.92 | 10.67 | 11.75 | 13.49 | 14.57 |
| Camarilla | 9.22 | 9.48 | 9.74 | 10.00 | 10.26 | 10.52 | 10.78 |
| Woodie | 5.76 | 7.68 | 8.59 | 10.50 | 11.41 | 13.33 | 14.24 |
| Fibonacci | 7.84 | 8.92 | 9.59 | 10.67 | 11.75 | 12.41 | 13.49 |
Numerical data
The following are the details of the technical indicators and moving averages that were collected to generate this technical analysis:
| RSI (14): | 32.47 | |
| MACD (12,26,9): | -0.9700 | |
| Directional Movement: | -16.26 | |
| AROON (14): | -92.86 | |
| DEMA (21): | 7.54 | |
| Parabolic SAR (0,02-0,02-0,2): | 10.79 | |
| Elder Ray (13): | -0.87 | |
| Super Trend (3,10): | 9.74 | |
| Zig ZAG (10): | 7.20 | |
| VORTEX (21): | 0.8700 | |
| Stochastique (14,3,5): | 11.18 | |
| TEMA (21): | 7.52 | |
| Williams %R (14): | -97.14 | |
| Chande Momentum Oscillator (20): | -3.70 | |
| Repulse (5,40,3): | -9.6800 | |
| ROCnROLL: | 2 | |
| TRIX (15,9): | -1.2500 | |
| Courbe Coppock: | 47.03 |
| MA7: | 7.86 | |
| MA20: | 8.95 | |
| MA50: | 10.35 | |
| MA100: | 15.00 | |
| MAexp7: | 7.91 | |
| MAexp20: | 8.84 | |
| MAexp50: | 10.88 | |
| MAexp100: | 13.63 | |
| Price / MA7: | -8.40% | |
| Price / MA20: | -19.55% | |
| Price / MA50: | -30.43% | |
| Price / MA100: | -52.00% | |
| Price / MAexp7: | -8.98% | |
| Price / MAexp20: | -18.55% | |
| Price / MAexp50: | -33.82% | |
| Price / MAexp100: | -47.18% |
News
The latest news and videos published on PACIFIC GAS & ELECTRIC CO. at the time of the analysis were as follows:
About author

Online


Add a comment
Comments
0 comments on the analysis PACIFIC GAS & ELECTRIC CO. - Daily