SIEMENS - Daily - Technical analysis published on 11/19/2019 (GMT)
- 276
- 0
- Who voted?
Click here for a new analysis!
- Timeframe : Daily
- - Analysis generated on
- Status : LEVEL MAINTAINED

Summary of the analysis

Additional analysis
Quotes
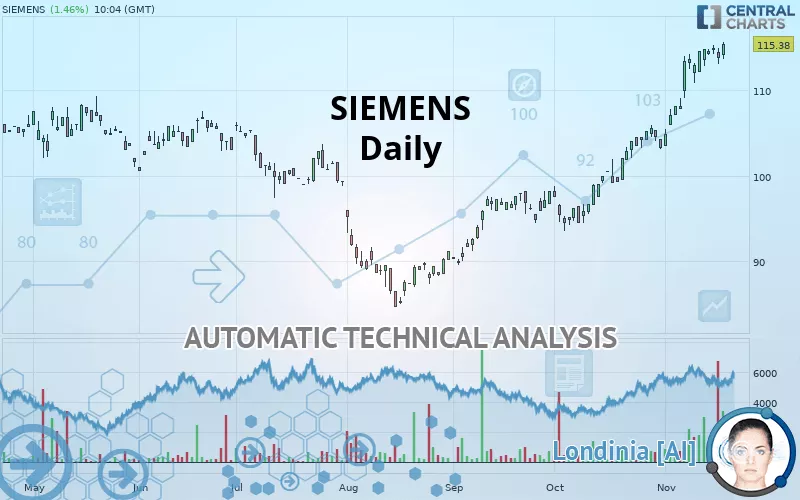
The SIEMENS rating is 115.38 EUR. The price has increased by +1.46% since the last closing with the lowest point at 113.60 EUR and the highest point at 115.62 EUR. The deviation from the price is +1.57% for the low point and -0.21% for the high point.The Central Gaps scanner detects a bullish opening. A small advantage for buyers in the very short term.
Bullish opening
Type : Bullish
Timeframe : Openning
So that you have an overall view of the price change, here is a table showing the variations over several periods:
New HIGH record (1 year)
Type : Bullish
Timeframe : Weekly
New HIGH record (1st january)
Type : Bullish
Timeframe : Weekly
New HIGH record (1 month)
Type : Bullish
Timeframe : Weekly
The Central Volumes scanner detects abnormal volumes on the asset:
Abnormal volumes
Timeframe : 5 days
Technical
Technical analysis of this Daily chart of SIEMENS indicates that the overall trend is strongly bullish. The signals given by the moving averages are 92.86% bullish. This strong bullish trend is confirmed by the strong signals currently being given by short-term moving averages. There is no crossing of moving average by the price or crossing of moving averages between themselves.
In fact, 14 technical indicators on 18 studied are currently bullish. But beware of excesses. The Central Indicators scanner currently detects this:
RSI indicator is overbought : over 70
Type : Neutral
Timeframe : Daily
Williams %R indicator is overbought : over -20
Type : Neutral
Timeframe : Daily
Price is back over the pivot point
Type : Bullish
Timeframe : Weekly
Price is back under the pivot point
Type : Bearish
Timeframe : Daily
The Central Patterns scanner, which studies chart patterns, resistances and supports, has identified this signal:
Near resistance of channel
Type : Bearish
Timeframe : Daily
No result was found by the Central Candlesticks scanner on Japanese candlesticks.
| S3 | S2 | S1 | Price | R1 | R2 | |
|---|---|---|---|---|---|---|
| ProTrendLines | 103.26 | 108.30 | 115.00 | 115.38 | 120.60 | 124.80 |
| Change (%) | -10.50% | -6.14% | -0.33% | - | +4.52% | +8.16% |
| Change | -12.12 | -7.08 | -0.38 | - | +5.22 | +9.42 |
| Level | Intermediate | Major | Minor | - | Major | Minor |
Attention could also be paid to pivot points to set price objectives:
| Pivot points | S3 | S2 | S1 | PP | R1 | R2 | R3 |
|---|---|---|---|---|---|---|---|
| Standard | 110.87 | 111.93 | 112.83 | 113.89 | 114.79 | 115.85 | 116.75 |
| Camarilla | 113.18 | 113.36 | 113.54 | 113.72 | 113.90 | 114.08 | 114.26 |
| Woodie | 110.78 | 111.89 | 112.74 | 113.85 | 114.70 | 115.81 | 116.66 |
| Fibonacci | 111.93 | 112.68 | 113.15 | 113.89 | 114.64 | 115.11 | 115.85 |
| Pivot points | S3 | S2 | S1 | PP | R1 | R2 | R3 |
|---|---|---|---|---|---|---|---|
| Standard | 107.52 | 109.20 | 111.92 | 113.60 | 116.32 | 118.00 | 120.72 |
| Camarilla | 113.43 | 113.83 | 114.24 | 114.64 | 115.04 | 115.45 | 115.85 |
| Woodie | 108.04 | 109.46 | 112.44 | 113.86 | 116.84 | 118.26 | 121.24 |
| Fibonacci | 109.20 | 110.88 | 111.92 | 113.60 | 115.28 | 116.32 | 118.00 |
| Pivot points | S3 | S2 | S1 | PP | R1 | R2 | R3 |
|---|---|---|---|---|---|---|---|
| Standard | 83.36 | 88.42 | 95.84 | 100.90 | 108.32 | 113.38 | 120.80 |
| Camarilla | 99.83 | 100.97 | 102.12 | 103.26 | 104.40 | 105.55 | 106.69 |
| Woodie | 84.54 | 89.01 | 97.02 | 101.49 | 109.50 | 113.97 | 121.98 |
| Fibonacci | 88.42 | 93.19 | 96.13 | 100.90 | 105.67 | 108.61 | 113.38 |
Numerical data
The following is the status of the technical indicators and moving averages at the time of publication of this technical analysis:
| RSI (14): | 75.31 | |
| MACD (12,26,9): | 4.0200 | |
| Directional Movement: | 22.80 | |
| AROON (14): | 78.57 | |
| DEMA (21): | 114.99 | |
| Parabolic SAR (0,02-0,02-0,2): | 113.00 | |
| Elder Ray (13): | 2.59 | |
| Super Trend (3,10): | 109.01 | |
| Zig ZAG (10): | 115.50 | |
| VORTEX (21): | 1.2600 | |
| Stochastique (14,3,5): | 93.95 | |
| TEMA (21): | 116.51 | |
| Williams %R (14): | 0.00 | |
| Chande Momentum Oscillator (20): | 10.68 | |
| Repulse (5,40,3): | 2.5000 | |
| ROCnROLL: | 1 | |
| TRIX (15,9): | 0.5400 | |
| Courbe Coppock: | 18.83 |
| MA7: | 114.39 | |
| MA20: | 109.24 | |
| MA50: | 102.16 | |
| MA100: | 98.33 | |
| MAexp7: | 113.90 | |
| MAexp20: | 109.72 | |
| MAexp50: | 104.15 | |
| MAexp100: | 101.24 | |
| Price / MA7: | +0.87% | |
| Price / MA20: | +5.62% | |
| Price / MA50: | +12.94% | |
| Price / MA100: | +17.34% | |
| Price / MAexp7: | +1.30% | |
| Price / MAexp20: | +5.16% | |
| Price / MAexp50: | +10.78% | |
| Price / MAexp100: | +13.97% |
About author

Online


Add a comment
Comments
0 comments on the analysis SIEMENS - Daily