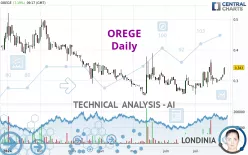
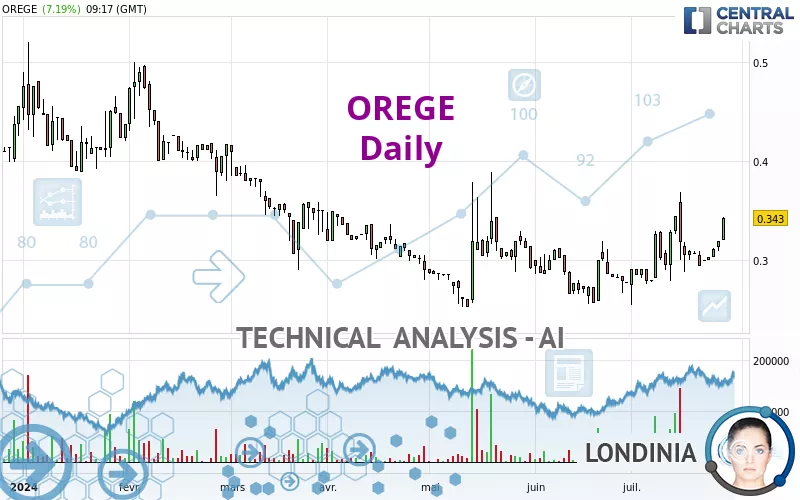
OREGE - Daily - Technical analysis published on 07/26/2024 (GMT)
- 125
- 0
Click here for a new analysis!
- Timeframe : Daily
- - Analysis generated on
- Status : TARGET REACHED
Summary of the analysis

Additional analysis
Quotes
The OREGE price is 0.343 EUR. The price registered an increase of +7.19% on the session with the lowest point at 0.321 EUR and the highest point at 0.344 EUR. The deviation from the price is +6.85% for the low point and -0.29% for the high point.A bullish gap was detected at the opening by the Central Gaps scanner. There are a lot of buyers and they have the upper hand in the very short term.
Opening Gap UP
Type : Bullish
Timeframe : Openning
So that you have an overall view of the price change, here is a table showing the variations over several periods:
Technical
A technical analysis in Daily of this OREGE chart shows a bullish trend. 67.86% of the signals given by moving averages are bullish. This bullish trend is supported by the strong bullish signals given by short-term moving averages. The Central Indicators market scanner currently does not detect any result that concerns moving averages.
In fact, 13 technical indicators on 18 studied are currently bullish. Caution: the Central Indicators scanner currently detects an excess:
CCI indicator is overbought : over 100
Type : Neutral
Timeframe : Daily
Pivot points : price is over resistance 3
Type : Neutral
Timeframe : Daily
Ichimoku : price is over the cloud
Type : Bullish
Timeframe : Daily
Price is back over the pivot point
Type : Bullish
Timeframe : Weekly
Williams %R indicator is back over -50
Type : Bullish
Timeframe : Daily
An analysis of the price chart with the Central Patterns scanner (detector of chart patterns and resistances and supports) shows several results that can have an impact on the price change:
Resistance of channel is broken
Type : Bullish
Timeframe : Daily
Resistance of triangle is broken
Type : Bullish
Timeframe : Daily
Central Candlesticks, the scanner specialised in Japanese candlesticks, detects a bullish signal that could support the hypothesis of a small rebound in the very short term:
Upside gap
Type : Bullish
Timeframe : Daily
| S3 | S2 | S1 | Price | R1 | R2 | R3 | |
|---|---|---|---|---|---|---|---|
| ProTrendLines | 0.255 | 0.278 | 0.304 | 0.343 | 0.348 | 0.399 | 0.490 |
| Change (%) | -25.66% | -18.95% | -11.37% | - | +1.46% | +16.33% | +42.86% |
| Change | -0.088 | -0.065 | -0.039 | - | +0.005 | +0.056 | +0.147 |
| Level | Major | Minor | Minor | - | Intermediate | Intermediate | Intermediate |
Attention could also be paid to pivot points to set price objectives:
| Pivot points | S3 | S2 | S1 | PP | R1 | R2 | R3 |
|---|---|---|---|---|---|---|---|
| Standard | 0.302 | 0.305 | 0.313 | 0.316 | 0.324 | 0.327 | 0.335 |
| Camarilla | 0.317 | 0.318 | 0.319 | 0.320 | 0.321 | 0.322 | 0.323 |
| Woodie | 0.304 | 0.306 | 0.315 | 0.317 | 0.326 | 0.328 | 0.337 |
| Fibonacci | 0.305 | 0.310 | 0.312 | 0.316 | 0.321 | 0.323 | 0.327 |
| Pivot points | S3 | S2 | S1 | PP | R1 | R2 | R3 |
|---|---|---|---|---|---|---|---|
| Standard | 0.184 | 0.236 | 0.265 | 0.317 | 0.346 | 0.398 | 0.427 |
| Camarilla | 0.272 | 0.279 | 0.287 | 0.294 | 0.301 | 0.309 | 0.316 |
| Woodie | 0.173 | 0.230 | 0.254 | 0.311 | 0.335 | 0.392 | 0.416 |
| Fibonacci | 0.236 | 0.267 | 0.286 | 0.317 | 0.348 | 0.367 | 0.398 |
| Pivot points | S3 | S2 | S1 | PP | R1 | R2 | R3 |
|---|---|---|---|---|---|---|---|
| Standard | 0.185 | 0.221 | 0.249 | 0.285 | 0.313 | 0.349 | 0.377 |
| Camarilla | 0.260 | 0.266 | 0.272 | 0.278 | 0.284 | 0.290 | 0.296 |
| Woodie | 0.182 | 0.219 | 0.246 | 0.283 | 0.310 | 0.347 | 0.374 |
| Fibonacci | 0.221 | 0.245 | 0.260 | 0.285 | 0.309 | 0.324 | 0.349 |
Numerical data
The following is the status of technical indicators and moving averages registered at the time this technical analysis was created:
| RSI (14): | 62.09 | |
| MACD (12,26,9): | 0.0070 | |
| Directional Movement: | 12.707 | |
| AROON (14): | 14.285 | |
| DEMA (21): | 0.317 | |
| Parabolic SAR (0,02-0,02-0,2): | 0.362 | |
| Elder Ray (13): | 0.021 | |
| Super Trend (3,10): | 0.279 | |
| Zig ZAG (10): | 0.344 | |
| VORTEX (21): | 1.1050 | |
| Stochastique (14,3,5): | 51.35 | |
| TEMA (21): | 0.323 | |
| Williams %R (14): | -27.78 | |
| Chande Momentum Oscillator (20): | 0.049 | |
| Repulse (5,40,3): | 12.4100 | |
| ROCnROLL: | 1 | |
| TRIX (15,9): | 0.2580 | |
| Courbe Coppock: | 12.17 |
| MA7: | 0.311 | |
| MA20: | 0.307 | |
| MA50: | 0.299 | |
| MA100: | 0.312 | |
| MAexp7: | 0.318 | |
| MAexp20: | 0.308 | |
| MAexp50: | 0.305 | |
| MAexp100: | 0.323 | |
| Price / MA7: | +10.29% | |
| Price / MA20: | +11.73% | |
| Price / MA50: | +14.72% | |
| Price / MA100: | +9.94% | |
| Price / MAexp7: | +7.86% | |
| Price / MAexp20: | +11.36% | |
| Price / MAexp50: | +12.46% | |
| Price / MAexp100: | +6.19% |
News
The last news published on OREGE at the time of the generation of this analysis was as follows:
- Orege activité et résultats semestriels 2023
- Résiliation du contrat de liquidité avec Kepler Cheuvreux et mise en oeuvre d'un nouveau contrat de liquidité avec NATIXIS ODDO BHF SCA
- Résultats Annuels 2022 et Perspectives 2023
- Orège sells three solutions to Severn Trent Water to improve the performance of anaerobic digestion and biogas production
- Oddo BHF initiates coverage of Orege
About author
Online


Add a comment
Comments
0 comments on the analysis OREGE - Daily