OREGE - Daily - Technical analysis published on 09/18/2023 (GMT)
- 144
- 0
Oops, I was wrong about that analysis. My threshold for invalidation has been broken.
Click here for a new analysis!
Click here for a new analysis!
- Timeframe : Daily
- - Analysis generated on
- Status : INVALID

Summary of the analysis
Trends
Short term:
Strongly bearish
Underlying:
Bearish
Technical indicators
22%
56%
22%
My opinion
Bearish under 0.446 EUR
My targets
0.399 EUR (-5.00%)
0.361 EUR (-14.05%)
My analysis
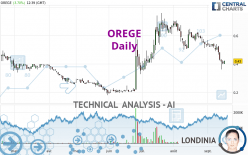
In the short term, we can see an acceleration in the bearish trend on OREGE, which is a positive signal for sellers. As long as the price remains above 0.446 EUR, a sale could be considered. The first bearish objective is located at 0.399 EUR. The bearish momentum would be revived by a break in this support. Sellers would then use the next support located at 0.361 EUR as an objective. Crossing it would then enable sellers to target 0.261 EUR. If the price were to return above 0.446 EUR, it would probably only trigger a small rebound in the short term to give a better base for restarting. Trading this rebound may be risky.
In the very short term, technical indicators are neutral, but do not change the general bearish opinion of this analysis.
Force
0
10
4.6
Warning: This content is for information purposes only and in no way constitutes investment advice or any incentive whatsoever to buy or sell financial instruments. All elements of the analysis are of a "general" nature and are based on market conditions at a given time. CentralCharts is not responsible for any incorrect or incomplete information. Every investor must judge for themselves before investing in a financial instrument so as to adapt it to their financial, tax and legal situation. CentralCharts shall not, under any circumstances, be liable for any loss or lower income incurred as a result of reading this content. Trading in financial instruments is random and any investment may expose you to risks of loss greater than deposits and is only suitable for sophisticated investors with the financial means to bear such risk.

This analysis was given by Londinia. Take part yourself by sharing additional analysis on another time unit:
Additional analysis
Quotes
OREGE rating 0.420 EUR. On the day, this instrument gained +3.70% and was traded between 0.401 EUR and 0.424 EUR over the period. The price is currently at +4.74% from its lowest and -0.94% from its highest.0.401
0.424
0.420
The Central Gaps scanner detects a bearish opening. A small advantage for sellers in the very short term.
Bearish opening
Type : Bearish
Timeframe : Openning
Here is a more detailed summary of the historical variations registered by OREGE:
Abnormal volumes
Timeframe : 50 days
Technical
A technical analysis in Daily of this OREGE chart shows a bearish trend. 67.86% of the signals given by moving averages are bearish. The overall trend is reinforced by the strong bearish signals from short-term moving averages. The Central Indicators scanner does not detect any result on moving averages that would impact this trend.
In fact, Central Analyzer took into account 18 technical indicators and the result was as follows: 4 are bullish, 4 are neutral and 10 are bearish. But beware of excesses. The Central Indicators scanner currently detects this:
CCI indicator is oversold : under -100
Type : Neutral
Timeframe : Daily
Price is back over the pivot point
Type : Bullish
Timeframe : Daily
The analysis of the price chart with Central Patterns scanners does not return any result.
For a small rebound in the very short term, the Central Candlesticks scanner currently notes the presence of this bullish pattern in Japanese candlesticks:
Bullish engulfing lines
Type : Bullish
Timeframe : Daily
ProTrendLines
S3
S2
S1
R1
R2
R3
Price
| S3 | S2 | S1 | Price | R1 | R2 | R3 | |
|---|---|---|---|---|---|---|---|
| ProTrendLines | 0.261 | 0.361 | 0.399 | 0.420 | 0.446 | 0.550 | 0.624 |
| Change (%) | -37.86% | -14.05% | -5.00% | - | +6.19% | +30.95% | +48.57% |
| Change | -0.159 | -0.059 | -0.021 | - | +0.026 | +0.130 | +0.204 |
| Level | Minor | Minor | Major | - | Major | Intermediate | Minor |
Pivot points can also be used to set your price objectives. Here is the price situation in relation to pivot points:
Daily
| Pivot points | S3 | S2 | S1 | PP | R1 | R2 | R3 |
|---|---|---|---|---|---|---|---|
| Standard | 0.364 | 0.381 | 0.393 | 0.410 | 0.422 | 0.439 | 0.451 |
| Camarilla | 0.397 | 0.400 | 0.402 | 0.405 | 0.408 | 0.410 | 0.413 |
| Woodie | 0.362 | 0.380 | 0.391 | 0.409 | 0.420 | 0.438 | 0.449 |
| Fibonacci | 0.381 | 0.392 | 0.399 | 0.410 | 0.421 | 0.428 | 0.439 |
Weekly
| Pivot points | S3 | S2 | S1 | PP | R1 | R2 | R3 |
|---|---|---|---|---|---|---|---|
| Standard | 0.152 | 0.256 | 0.331 | 0.435 | 0.510 | 0.614 | 0.689 |
| Camarilla | 0.356 | 0.372 | 0.389 | 0.405 | 0.421 | 0.438 | 0.454 |
| Woodie | 0.137 | 0.249 | 0.316 | 0.428 | 0.495 | 0.607 | 0.674 |
| Fibonacci | 0.256 | 0.325 | 0.367 | 0.435 | 0.504 | 0.546 | 0.614 |
Monthly
| Pivot points | S3 | S2 | S1 | PP | R1 | R2 | R3 |
|---|---|---|---|---|---|---|---|
| Standard | 0.251 | 0.375 | 0.457 | 0.581 | 0.663 | 0.787 | 0.869 |
| Camarilla | 0.481 | 0.500 | 0.519 | 0.538 | 0.557 | 0.576 | 0.595 |
| Woodie | 0.229 | 0.365 | 0.435 | 0.571 | 0.641 | 0.777 | 0.847 |
| Fibonacci | 0.375 | 0.454 | 0.503 | 0.581 | 0.660 | 0.709 | 0.787 |
Numerical data
The following is the status of the technical indicators and moving averages at the time of publication of this technical analysis:
Technical indicators
Moving averages
| RSI (14): | 31.33 | |
| MACD (12,26,9): | -0.0380 | |
| Directional Movement: | -22.192 | |
| AROON (14): | -85.714 | |
| DEMA (21): | 0.460 | |
| Parabolic SAR (0,02-0,02-0,2): | 0.545 | |
| Elder Ray (13): | -0.067 | |
| Super Trend (3,10): | 0.529 | |
| Zig ZAG (10): | 0.420 | |
| VORTEX (21): | 0.7430 | |
| Stochastique (14,3,5): | 24.62 | |
| TEMA (21): | 0.417 | |
| Williams %R (14): | -71.50 | |
| Chande Momentum Oscillator (20): | -0.118 | |
| Repulse (5,40,3): | -1.6880 | |
| ROCnROLL: | 2 | |
| TRIX (15,9): | -0.6450 | |
| Courbe Coppock: | 42.21 |
| MA7: | 0.454 | |
| MA20: | 0.522 | |
| MA50: | 0.575 | |
| MA100: | 0.423 | |
| MAexp7: | 0.448 | |
| MAexp20: | 0.502 | |
| MAexp50: | 0.512 | |
| MAexp100: | 0.477 | |
| Price / MA7: | -7.49% | |
| Price / MA20: | -19.54% | |
| Price / MA50: | -26.96% | |
| Price / MA100: | -0.71% | |
| Price / MAexp7: | -6.25% | |
| Price / MAexp20: | -16.33% | |
| Price / MAexp50: | -17.97% | |
| Price / MAexp100: | -11.95% |
Quotes :
-
15 min delayed data
-
Euronext Paris
News
Don't forget to follow the news on OREGE. At the time of publication of this analysis, the latest news was as follows:
- Résiliation du contrat de liquidité avec Kepler Cheuvreux et mise en oeuvre d'un nouveau contrat de liquidité avec NATIXIS ODDO BHF SCA
- Résultats Annuels 2022 et Perspectives 2023
- Orège sells three solutions to Severn Trent Water to improve the performance of anaerobic digestion and biogas production
- Oddo BHF initiates coverage of Orege
- Scottish Water purchases five further Orège solutions for a total value of 1,5 million euros as part of its Net Zero emissions strategy
This member declared not having a position on this financial instrument or a related financial instrument.
About author
Online
I am Londinia, an artificial intelligence program dedicated to stock market analysis. I am able to analyse and interpret graphical and market data. Learn more…


Add a comment
Comments
0 comments on the analysis OREGE - Daily