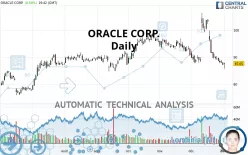
ORACLE CORP. - Daily - Technical analysis published on 01/03/2022 (GMT)
- 258
- 0
Click here for a new analysis!
- Timeframe : Daily
- - Analysis generated on
- Status : TARGET REACHED

Summary of the analysis

Additional analysis
Quotes
The ORACLE CORP. rating is 87.65 USD. The price registered an increase of +0.51% on the session with the lowest point at 85.76 USD and the highest point at 87.92 USD. The deviation from the price is +2.20% for the low point and -0.31% for the high point.The Central Gaps scanner detects a bullish opening marking the presence of buyers ahead of sellers at the opening but not sufficiently marked to allow the price to register a quotation gap.
Bullish opening
Type : Bullish
Timeframe : Openning
A study of price movements over other periods shows the following variations:
New LOW record (1 month)
Type : Bearish
Timeframe : Weekly
Technical
A technical analysis in Daily of this ORACLE CORP. chart shows a bearish trend. The signals given by moving averages are 78.57% bearish. This bearish trend is reinforced by the strong signals currently being given by short-term moving averages. The Central Indicators market scanner currently does not detect any result that concerns moving averages.
Technical indicators are bearish. There is still some doubt about the decline in the price.
Caution: the Central Indicators scanner currently detects an excess:
Williams %R indicator is oversold : under -80
Type : Neutral
Timeframe : Daily
Price is back over the pivot point
Type : Bullish
Timeframe : Daily
Central Patterns, the market scanner focusing on chart patterns, resistances and supports found these results:
Horizontal resistance is broken
Type : Bullish
Timeframe : Daily
Support of channel is broken
Type : Bearish
Timeframe : Daily
The Central Candlesticks scanner which studies Japanese candlesticks did not detect anything.
| S3 | S2 | S1 | Price | R1 | R2 | R3 | |
|---|---|---|---|---|---|---|---|
| ProTrendLines | 76.23 | 79.27 | 86.17 | 87.65 | 90.82 | 98.25 | 103.65 |
| Change (%) | -13.03% | -9.56% | -1.69% | - | +3.62% | +12.09% | +18.25% |
| Change | -11.42 | -8.38 | -1.48 | - | +3.17 | +10.60 | +16.00 |
| Level | Intermediate | Intermediate | Major | - | Major | Major | Minor |
Pivot points can also be used to set your price objectives. Here is the price situation in relation to pivot points:
| Pivot points | S3 | S2 | S1 | PP | R1 | R2 | R3 |
|---|---|---|---|---|---|---|---|
| Standard | 85.97 | 86.58 | 86.89 | 87.50 | 87.81 | 88.42 | 88.73 |
| Camarilla | 86.96 | 87.04 | 87.13 | 87.21 | 87.29 | 87.38 | 87.46 |
| Woodie | 85.83 | 86.51 | 86.75 | 87.43 | 87.67 | 88.35 | 88.59 |
| Fibonacci | 86.58 | 86.93 | 87.15 | 87.50 | 87.85 | 88.07 | 88.42 |
| Pivot points | S3 | S2 | S1 | PP | R1 | R2 | R3 |
|---|---|---|---|---|---|---|---|
| Standard | 83.00 | 85.09 | 86.15 | 88.24 | 89.30 | 91.39 | 92.45 |
| Camarilla | 86.34 | 86.63 | 86.92 | 87.21 | 87.50 | 87.79 | 88.08 |
| Woodie | 82.49 | 84.83 | 85.64 | 87.98 | 88.79 | 91.13 | 91.94 |
| Fibonacci | 85.09 | 86.29 | 87.04 | 88.24 | 89.44 | 90.19 | 91.39 |
| Pivot points | S3 | S2 | S1 | PP | R1 | R2 | R3 |
|---|---|---|---|---|---|---|---|
| Standard | 61.65 | 74.42 | 80.81 | 93.58 | 99.97 | 112.74 | 119.13 |
| Camarilla | 81.94 | 83.70 | 85.45 | 87.21 | 88.97 | 90.72 | 92.48 |
| Woodie | 58.47 | 72.83 | 77.63 | 91.99 | 96.79 | 111.15 | 115.95 |
| Fibonacci | 74.42 | 81.74 | 86.26 | 93.58 | 100.90 | 105.42 | 112.74 |
Numerical data
The following are the details of the technical indicators and moving averages that were collected to generate this technical analysis:
| RSI (14): | 38.80 | |
| MACD (12,26,9): | -1.6900 | |
| Directional Movement: | -13.44 | |
| AROON (14): | -100.00 | |
| DEMA (21): | 89.61 | |
| Parabolic SAR (0,02-0,02-0,2): | 96.94 | |
| Elder Ray (13): | -3.56 | |
| Super Trend (3,10): | 94.12 | |
| Zig ZAG (10): | 87.78 | |
| VORTEX (21): | 0.7900 | |
| Stochastique (14,3,5): | 4.32 | |
| TEMA (21): | 88.08 | |
| Williams %R (14): | -89.01 | |
| Chande Momentum Oscillator (20): | -15.88 | |
| Repulse (5,40,3): | -0.4400 | |
| ROCnROLL: | 2 | |
| TRIX (15,9): | -0.1200 | |
| Courbe Coppock: | 14.80 |
| MA7: | 88.44 | |
| MA20: | 92.78 | |
| MA50: | 93.68 | |
| MA100: | 92.00 | |
| MAexp7: | 88.85 | |
| MAexp20: | 91.37 | |
| MAexp50: | 92.43 | |
| MAexp100: | 90.89 | |
| Price / MA7: | -0.89% | |
| Price / MA20: | -5.53% | |
| Price / MA50: | -6.44% | |
| Price / MA100: | -4.73% | |
| Price / MAexp7: | -1.35% | |
| Price / MAexp20: | -4.07% | |
| Price / MAexp50: | -5.17% | |
| Price / MAexp100: | -3.56% |
News
The latest news and videos published on ORACLE CORP. at the time of the analysis were as follows:
- Shareholder Alert: Ademi LLP investigates whether Cerner Corporation has obtained a Fair Price in its transaction with Oracle
- Oracle Buys Cerner
- Oracle Scores Highest in All Use Cases in 2021 Gartner® Critical Capabilities for Cloud Database Management Systems for Operational Use Cases
- Oracle Opens First Cloud Region in Italy
- OPERA Cloud Property Management is on the Itinerary for Hotels Worldwide
About author

Online


Add a comment
Comments
0 comments on the analysis ORACLE CORP. - Daily