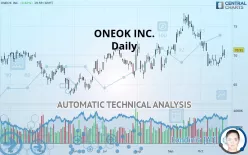
ONEOK INC. - Daily - Technical analysis published on 10/24/2019 (GMT)
- 335
- 0
- Who voted?
Click here for a new analysis!
- Timeframe : Daily
- - Analysis generated on
- Status : TARGET REACHED

Summary of the analysis

Additional analysis
Quotes
ONEOK INC. rating 70.91 USD. The price registered an increase of +0.83% on the session and was between 69.53 USD and 70.97 USD. This implies that the price is at +1.98% from its lowest and at -0.08% from its highest.The Central Gaps scanner detects a bearish opening. A small advantage for sellers in the very short term.
Bearish opening
Type : Bearish
Timeframe : Openning
Here is a more detailed summary of the historical variations registered by ONEOK INC.:
Near a new LOW record (1 month)
Type : Bearish
Timeframe : Weekly
Technical
A technical analysis in Daily of this ONEOK INC. chart shows a bullish trend. 75% of the signals given by moving averages are bullish. This bullish trend shows slight signs of slowing down given the slightly bullish signals given by the short-term moving averages. The Central Indicators scanner detects bullish signals on moving averages that could impact this trend:
Bullish price crossover with adaptative moving average 20
Type : Bullish
Timeframe : Daily
Bullish price crossover with adaptative moving average 50
Type : Bullish
Timeframe : Daily
In fact, 11 technical indicators on 18 studied are currently positioned bullish. But beware of excesses. The Central Indicators scanner currently detects this:
Williams %R indicator is overbought : over -20
Type : Neutral
Timeframe : Daily
Pivot points : price is over resistance 1
Type : Neutral
Timeframe : Weekly
Williams %R indicator is back over -50
Type : Bullish
Timeframe : Daily
Central Patterns, the market scanner focusing on chart patterns, resistances and supports found this result:
Horizontal resistance is broken
Type : Bullish
Timeframe : Daily
From the Japanese candlestick perspective, the Central Candlesticks scanner notes the presence of these results that could impact the short-term trend:
White gravestone / inverted hammer
Type : Neutral
Timeframe : Daily
Upside gap
Type : Bullish
Timeframe : Daily
| S3 | S2 | S1 | Price | R1 | R2 | R3 | |
|---|---|---|---|---|---|---|---|
| ProTrendLines | 63.62 | 66.76 | 68.19 | 70.91 | 71.19 | 73.69 | 76.50 |
| Change (%) | -10.28% | -5.85% | -3.84% | - | +0.39% | +3.92% | +7.88% |
| Change | -7.29 | -4.15 | -2.72 | - | +0.28 | +2.78 | +5.59 |
| Level | Major | Intermediate | Major | - | Major | Intermediate | Major |
Pivot points can also be used to set your price objectives. Here is the price situation in relation to pivot points:
| Pivot points | S3 | S2 | S1 | PP | R1 | R2 | R3 |
|---|---|---|---|---|---|---|---|
| Standard | 67.52 | 68.62 | 69.47 | 70.57 | 71.42 | 72.52 | 73.37 |
| Camarilla | 69.79 | 69.97 | 70.15 | 70.33 | 70.51 | 70.69 | 70.87 |
| Woodie | 67.41 | 68.56 | 69.36 | 70.51 | 71.31 | 72.46 | 73.26 |
| Fibonacci | 68.62 | 69.36 | 69.82 | 70.57 | 71.31 | 71.77 | 72.52 |
| Pivot points | S3 | S2 | S1 | PP | R1 | R2 | R3 |
|---|---|---|---|---|---|---|---|
| Standard | 66.14 | 67.11 | 68.15 | 69.12 | 70.16 | 71.13 | 72.17 |
| Camarilla | 68.65 | 68.83 | 69.02 | 69.20 | 69.38 | 69.57 | 69.75 |
| Woodie | 66.19 | 67.13 | 68.20 | 69.14 | 70.21 | 71.15 | 72.22 |
| Fibonacci | 67.11 | 67.87 | 68.35 | 69.12 | 69.88 | 70.36 | 71.13 |
| Pivot points | S3 | S2 | S1 | PP | R1 | R2 | R3 |
|---|---|---|---|---|---|---|---|
| Standard | 62.95 | 66.50 | 70.10 | 73.65 | 77.25 | 80.80 | 84.40 |
| Camarilla | 71.72 | 72.38 | 73.04 | 73.69 | 74.35 | 75.00 | 75.66 |
| Woodie | 62.97 | 66.51 | 70.12 | 73.66 | 77.27 | 80.81 | 84.42 |
| Fibonacci | 66.50 | 69.24 | 70.92 | 73.65 | 76.39 | 78.07 | 80.80 |
Numerical data
The following is the status of the technical indicators and moving averages at the time of publication of this technical analysis:
| RSI (14): | 51.29 | |
| MACD (12,26,9): | -0.6800 | |
| Directional Movement: | -0.14 | |
| AROON (14): | -64.29 | |
| DEMA (21): | 69.60 | |
| Parabolic SAR (0,02-0,02-0,2): | 68.24 | |
| Elder Ray (13): | 0.20 | |
| Super Trend (3,10): | 72.17 | |
| Zig ZAG (10): | 70.91 | |
| VORTEX (21): | 0.8200 | |
| Stochastique (14,3,5): | 50.63 | |
| TEMA (21): | 68.88 | |
| Williams %R (14): | -34.94 | |
| Chande Momentum Oscillator (20): | 0.19 | |
| Repulse (5,40,3): | 2.3400 | |
| ROCnROLL: | 1 | |
| TRIX (15,9): | -0.1600 | |
| Courbe Coppock: | 6.90 |
| MA7: | 69.49 | |
| MA20: | 70.52 | |
| MA50: | 71.41 | |
| MA100: | 69.41 | |
| MAexp7: | 69.89 | |
| MAexp20: | 70.45 | |
| MAexp50: | 70.71 | |
| MAexp100: | 69.64 | |
| Price / MA7: | +2.04% | |
| Price / MA20: | +0.55% | |
| Price / MA50: | -0.70% | |
| Price / MA100: | +2.16% | |
| Price / MAexp7: | +1.46% | |
| Price / MAexp20: | +0.65% | |
| Price / MAexp50: | +0.28% | |
| Price / MAexp100: | +1.82% |
News
Don"t forget to follow the news on ONEOK INC.. At the time of publication of this analysis, the latest news was as follows:
- ONEOK Increases Quarterly Dividend
- ONEOK Third-quarter 2019 Conference Call and Webcast Scheduled
- ONEOK Included in Dow Jones Sustainability North America Index
- ONEOK to Present at Barclays CEO Energy Conference
- ONEOK to Participate in the Citi Midstream Infrastructure Conference
About author

Online


Add a comment
Comments
0 comments on the analysis ONEOK INC. - Daily