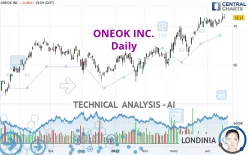
ONEOK INC. - Daily - Technical analysis published on 04/20/2022 (GMT)
- 296
- 0
Click here for a new analysis!
- Timeframe : Daily
- - Analysis generated on
- Status : INVALID

Summary of the analysis

Additional analysis
Quotes
The ONEOK INC. price is 72.17 USD. The price is lower by -0.46% since the last closing with the lowest point at 71.92 USD and the highest point at 73.07 USD. The deviation from the price is +0.35% for the low point and -1.23% for the high point.A bearish opening was detected by the Central Gaps scanner. Sellers are trying to impose a bearish trend in the very short term.
Bearish opening
Type : Bearish
Timeframe : Openning
So that you have an overall view of the price change, here is a table showing the variations over several periods:
New HIGH record (5 years)
Type : Bullish
Timeframe : Weekly
Near a new HIGH record (1 year)
Type : Bullish
Timeframe : Weekly
Near a new HIGH record (1st january)
Type : Bullish
Timeframe : Weekly
Near a new HIGH record (1 month)
Type : Bullish
Timeframe : Weekly
Technical
Technical analysis of ONEOK INC. in Daily shows a strongly overall bullish trend. The signals given by the moving averages are 92.86% bullish. This strong bullish trend is confirmed by the strong signals currently being given by short-term moving averages. The Central Indicators market scanner currently does not detect any result that concerns moving averages.
In fact, according to the parameters integrated into the Central Analyzer system, 10 technical indicators out of 18 analysed are currently bullish. But beware of excesses. The Central Indicators scanner currently detects this:
CCI indicator is overbought : over 100
Type : Neutral
Timeframe : Daily
CCI indicator: bearish divergence
Type : Bearish
Timeframe : Daily
MACD indicator: bearish divergence
Type : Bearish
Timeframe : Daily
Pivot points : price is over resistance 1
Type : Neutral
Timeframe : Weekly
An analysis of the price chart with the Central Patterns scanner (detector of chart patterns and resistances and supports) shows a result that can have an impact on the price change:
Horizontal support is broken
Type : Bearish
Timeframe : Daily
The Central Candlesticks scanner which studies Japanese candlesticks did not detect anything.
| S3 | S2 | S1 | Price | R1 | |
|---|---|---|---|---|---|
| ProTrendLines | 63.87 | 67.70 | 69.84 | 72.17 | 72.27 |
| Change (%) | -11.50% | -6.19% | -3.23% | - | +0.14% |
| Change | -8.30 | -4.47 | -2.33 | - | +0.10 |
| Level | Intermediate | Major | Intermediate | - | Major |
Pivot points can also be used to set your price objectives. Here is the price situation in relation to pivot points:
| Pivot points | S3 | S2 | S1 | PP | R1 | R2 | R3 |
|---|---|---|---|---|---|---|---|
| Standard | 70.55 | 71.24 | 71.70 | 72.39 | 72.85 | 73.54 | 74.00 |
| Camarilla | 71.85 | 71.96 | 72.07 | 72.17 | 72.28 | 72.38 | 72.49 |
| Woodie | 70.45 | 71.18 | 71.60 | 72.33 | 72.75 | 73.48 | 73.90 |
| Fibonacci | 71.24 | 71.68 | 71.95 | 72.39 | 72.83 | 73.10 | 73.54 |
| Pivot points | S3 | S2 | S1 | PP | R1 | R2 | R3 |
|---|---|---|---|---|---|---|---|
| Standard | 68.31 | 69.13 | 70.22 | 71.04 | 72.13 | 72.95 | 74.04 |
| Camarilla | 70.78 | 70.95 | 71.13 | 71.30 | 71.48 | 71.65 | 71.83 |
| Woodie | 68.44 | 69.20 | 70.35 | 71.11 | 72.26 | 73.02 | 74.17 |
| Fibonacci | 69.13 | 69.86 | 70.31 | 71.04 | 71.77 | 72.22 | 72.95 |
| Pivot points | S3 | S2 | S1 | PP | R1 | R2 | R3 |
|---|---|---|---|---|---|---|---|
| Standard | 54.26 | 58.23 | 64.43 | 68.40 | 74.60 | 78.57 | 84.77 |
| Camarilla | 67.83 | 68.77 | 69.70 | 70.63 | 71.56 | 72.50 | 73.43 |
| Woodie | 55.38 | 58.79 | 65.55 | 68.96 | 75.72 | 79.13 | 85.89 |
| Fibonacci | 58.23 | 62.12 | 64.52 | 68.40 | 72.29 | 74.69 | 78.57 |
Numerical data
The following is the status of technical indicators and moving averages registered at the time this technical analysis was created:
| RSI (14): | 61.91 | |
| MACD (12,26,9): | 1.3300 | |
| Directional Movement: | 9.37 | |
| AROON (14): | 92.86 | |
| DEMA (21): | 72.34 | |
| Parabolic SAR (0,02-0,02-0,2): | 70.68 | |
| Elder Ray (13): | 1.40 | |
| Super Trend (3,10): | 67.78 | |
| Zig ZAG (10): | 72.17 | |
| VORTEX (21): | 1.0800 | |
| Stochastique (14,3,5): | 69.29 | |
| TEMA (21): | 72.21 | |
| Williams %R (14): | -31.59 | |
| Chande Momentum Oscillator (20): | 1.54 | |
| Repulse (5,40,3): | -0.1000 | |
| ROCnROLL: | 1 | |
| TRIX (15,9): | 0.3100 | |
| Courbe Coppock: | 2.79 |
| MA7: | 71.42 | |
| MA20: | 70.93 | |
| MA50: | 67.17 | |
| MA100: | 63.39 | |
| MAexp7: | 71.58 | |
| MAexp20: | 70.45 | |
| MAexp50: | 67.70 | |
| MAexp100: | 64.72 | |
| Price / MA7: | +1.05% | |
| Price / MA20: | +1.75% | |
| Price / MA50: | +7.44% | |
| Price / MA100: | +13.85% | |
| Price / MAexp7: | +0.82% | |
| Price / MAexp20: | +2.44% | |
| Price / MAexp50: | +6.60% | |
| Price / MAexp100: | +11.51% |
News
Don't forget to follow the news on ONEOK INC.. At the time of publication of this analysis, the latest news was as follows:
- ONEOK First Quarter 2022 Conference Call and Webcast Scheduled
- ONEOK to Participate in U.S. Capital Advisors Midstream Corporate Access Day
- ONEOK to Participate in Mizuho Energy Summit
- ONEOK Schedules 2022 Annual Meeting of Shareholders; Sets Record Date
- ONEOK to Participate in Barclays Investment Grade Energy & Pipeline Corporate Days
About author

Online


Add a comment
Comments
0 comments on the analysis ONEOK INC. - Daily