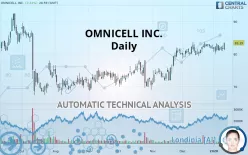
OMNICELL INC. - Daily - Technical analysis published on 01/14/2020 (GMT)
- 239
- 0
- Who voted?
Click here for a new analysis!
- Timeframe : Daily
- - Analysis generated on
- Status : TARGET REACHED

Summary of the analysis

Additional analysis
Quotes
The OMNICELL INC. rating is 83.39 USD. The price registered an increase of +2.24% on the session and was traded between 81.16 USD and 83.46 USD over the period. The price is currently at +2.75% from its lowest and -0.08% from its highest.A bearish opening was detected by the Central Gaps scanner. Sellers are trying to impose a bearish trend in the very short term.
Bearish opening
Type : Bearish
Timeframe : Openning
Here is a more detailed summary of the historical variations registered by OMNICELL INC.:
Near a new LOW record (1st january)
Type : Bearish
Timeframe : Weekly
Near a new LOW record (1 month)
Type : Bearish
Timeframe : Weekly
Technical
Technical analysis of this Daily chart of OMNICELL INC. indicates that the overall trend is strongly bullish. The signals given by the moving averages are 92.86% bullish. This strong bullish trend is confirmed by the strong signals currently being given by short-term moving averages. There is no crossing of moving average by the price or crossing of moving averages between themselves.
In fact, 12 technical indicators on 18 studied are currently positioned bullish. But beware of excesses. The Central Indicators scanner currently detects this:
Williams %R indicator is overbought : over -20
Type : Neutral
Timeframe : Daily
Pivot points : price is over resistance 1
Type : Neutral
Timeframe : Weekly
Pivot points : price is over resistance 2
Type : Neutral
Timeframe : Daily
Price is back under the pivot point
Type : Bearish
Timeframe : Daily
Central Patterns, the market scanner focusing on chart patterns, resistances and supports found these results:
Resistance of channel is broken
Type : Bullish
Timeframe : Daily
Resistance of triangle is broken
Type : Bullish
Timeframe : Daily
No result was found by the Central Candlesticks scanner on Japanese candlesticks.
| S3 | S2 | S1 | Price | R1 | R2 | R3 | |
|---|---|---|---|---|---|---|---|
| ProTrendLines | 72.53 | 74.80 | 81.17 | 83.39 | 83.77 | 86.19 | 88.34 |
| Change (%) | -13.02% | -10.30% | -2.66% | - | +0.46% | +3.36% | +5.94% |
| Change | -10.86 | -8.59 | -2.22 | - | +0.38 | +2.80 | +4.95 |
| Level | Minor | Intermediate | Major | - | Major | Intermediate | Minor |
Attention could also be paid to pivot points to set price objectives:
| Pivot points | S3 | S2 | S1 | PP | R1 | R2 | R3 |
|---|---|---|---|---|---|---|---|
| Standard | 79.12 | 80.00 | 80.78 | 81.65 | 82.43 | 83.31 | 84.09 |
| Camarilla | 81.11 | 81.26 | 81.41 | 81.56 | 81.71 | 81.86 | 82.02 |
| Woodie | 79.08 | 79.97 | 80.73 | 81.63 | 82.39 | 83.28 | 84.04 |
| Fibonacci | 80.00 | 80.63 | 81.02 | 81.65 | 82.28 | 82.67 | 83.31 |
| Pivot points | S3 | S2 | S1 | PP | R1 | R2 | R3 |
|---|---|---|---|---|---|---|---|
| Standard | 78.04 | 79.45 | 80.51 | 81.92 | 82.98 | 84.39 | 85.45 |
| Camarilla | 80.88 | 81.11 | 81.33 | 81.56 | 81.79 | 82.01 | 82.24 |
| Woodie | 77.86 | 79.36 | 80.33 | 81.83 | 82.80 | 84.30 | 85.27 |
| Fibonacci | 79.45 | 80.40 | 80.98 | 81.92 | 82.87 | 83.45 | 84.39 |
| Pivot points | S3 | S2 | S1 | PP | R1 | R2 | R3 |
|---|---|---|---|---|---|---|---|
| Standard | 73.64 | 76.10 | 78.91 | 81.37 | 84.18 | 86.64 | 89.45 |
| Camarilla | 80.27 | 80.75 | 81.24 | 81.72 | 82.20 | 82.69 | 83.17 |
| Woodie | 73.82 | 76.19 | 79.09 | 81.46 | 84.36 | 86.73 | 89.63 |
| Fibonacci | 76.10 | 78.11 | 79.36 | 81.37 | 83.38 | 84.63 | 86.64 |
Numerical data
The following is the status of the technical indicators and moving averages at the time of publication of this technical analysis:
| RSI (14): | 61.06 | |
| MACD (12,26,9): | 0.7800 | |
| Directional Movement: | 9.05 | |
| AROON (14): | -50.00 | |
| DEMA (21): | 82.78 | |
| Parabolic SAR (0,02-0,02-0,2): | 80.31 | |
| Elder Ray (13): | 0.37 | |
| Super Trend (3,10): | 77.68 | |
| Zig ZAG (10): | 83.39 | |
| VORTEX (21): | 0.9700 | |
| Stochastique (14,3,5): | 53.97 | |
| TEMA (21): | 82.35 | |
| Williams %R (14): | -11.64 | |
| Chande Momentum Oscillator (20): | 0.90 | |
| Repulse (5,40,3): | 2.7200 | |
| ROCnROLL: | 1 | |
| TRIX (15,9): | 0.1800 | |
| Courbe Coppock: | 1.21 |
| MA7: | 82.04 | |
| MA20: | 81.77 | |
| MA50: | 78.94 | |
| MA100: | 75.92 | |
| MAexp7: | 82.12 | |
| MAexp20: | 81.59 | |
| MAexp50: | 79.57 | |
| MAexp100: | 77.80 | |
| Price / MA7: | +1.65% | |
| Price / MA20: | +1.98% | |
| Price / MA50: | +5.64% | |
| Price / MA100: | +9.84% | |
| Price / MAexp7: | +1.55% | |
| Price / MAexp20: | +2.21% | |
| Price / MAexp50: | +4.80% | |
| Price / MAexp100: | +7.19% |
News
Don"t forget to follow the news on OMNICELL INC.. At the time of publication of this analysis, the latest news was as follows:
- Omnicell to Present at the 38th Annual J.P. Morgan Healthcare Conference
- Omnicell to Present Strategic Priorities and Long-Term Financial Targets at Annual Innovation Day for Investors and Analysts
- Omnicell and Kit Check Partner to Offer Cloud-based Solution for Tracking of Controlled Substances
- Omnicell and Huron to Provide Outcome-Based Professional Services
- Omnicell to Unveil Latest Advancements to Its Medication Management Solution Portfolio in Automation, Intelligence, and Services at 2019 ASHP Midyear Meeting
About author

Online


Add a comment
Comments
0 comments on the analysis OMNICELL INC. - Daily