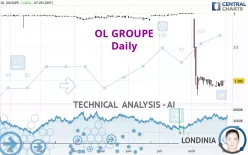
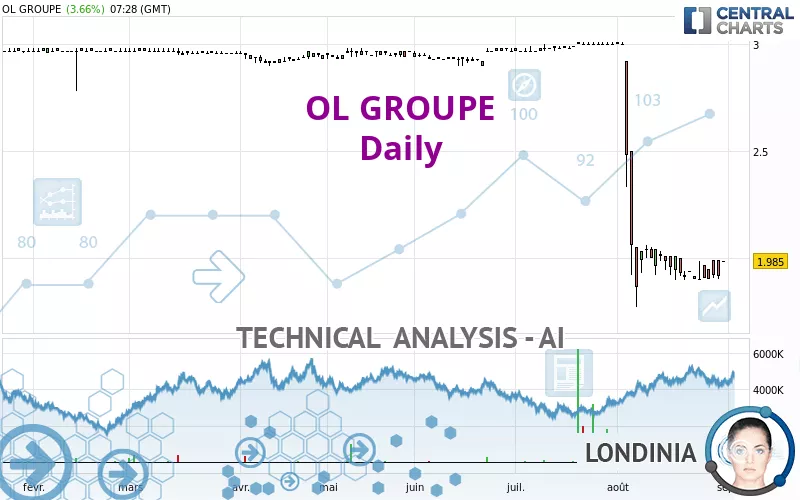
EAGLEFOOTBALLGROUP - Daily - Technical analysis published on 08/31/2023 (GMT)
- 252
- 0
Click here for a new analysis!
- Timeframe : Daily
- - Analysis generated on
- Status : TARGET REACHED
Summary of the analysis

Additional analysis
Quotes
The OL GROUPE rating is 1.985 EUR. The price registered an increase of +3.66% on the session and was between 1.985 EUR and 1.985 EUR. This implies that the price is at 0% from its lowest and at 0% from its highest.A bullish opening was detected by the Central Gaps scanner. Buyers are trying to impose a bullish momentum in the very short term.
Bullish opening
Type : Bullish
Timeframe : Openning
So that you have an overall view of the price change, here is a table showing the variations over several periods:
Technical
Technical analysis of OL GROUPE in Daily shows a overall strongly bearish trend. 85.71% of the signals given by moving averages are bearish. This strongly bearish trend is showing signs of slowing down given the slightly bearish signals given by short-term moving averages. An assessment of moving averages reveals several bullish signals that could impact this trend:
Bullish price crossover with Moving Average 20
Type : Bullish
Timeframe : Daily
Bullish price crossover with adaptative moving average 20
Type : Bullish
Timeframe : Daily
Bullish price crossover with adaptative moving average 50
Type : Bullish
Timeframe : Daily
In fact, of the 18 technical indicators analysed by Central Analyzer, 7 are bullish, 7 are neutral and 4 are bearish. Other results related to technical indicators were also found by the Central Indicators scanner:
Pivot points : price is over resistance 1
Type : Neutral
Timeframe : Daily
Pivot points : price is over resistance 1
Type : Neutral
Timeframe : Weekly
Williams %R indicator is back over -50
Type : Bullish
Timeframe : Daily
No signals are given by Central Patterns, a market scanner specialised in chart patterns, resistances and supports.
Central Candlesticks, the scanner specialised in Japanese candlesticks, detects these signals that could have an impact on the current short-term trend:
Bullish harami cross
Type : Bullish
Timeframe : Daily
Doji
Type : Neutral
Timeframe : Daily
| S1 | Price | R1 | R2 | R3 | |
|---|---|---|---|---|---|
| ProTrendLines | 1.941 | 1.985 | 2.179 | 2.458 | 2.640 |
| Change (%) | -2.22% | - | +9.77% | +23.83% | +33.00% |
| Change | -0.044 | - | +0.194 | +0.473 | +0.655 |
| Level | Major | - | Intermediate | Minor | Minor |
Pivot points can also be used to set your price objectives. Here is the price situation in relation to pivot points:
| Pivot points | S3 | S2 | S1 | PP | R1 | R2 | R3 |
|---|---|---|---|---|---|---|---|
| Standard | 1.790 | 1.845 | 1.880 | 1.935 | 1.970 | 2.025 | 2.060 |
| Camarilla | 1.890 | 1.899 | 1.907 | 1.915 | 1.923 | 1.932 | 1.940 |
| Woodie | 1.780 | 1.840 | 1.870 | 1.930 | 1.960 | 2.020 | 2.050 |
| Fibonacci | 1.845 | 1.879 | 1.901 | 1.935 | 1.969 | 1.991 | 2.025 |
| Pivot points | S3 | S2 | S1 | PP | R1 | R2 | R3 |
|---|---|---|---|---|---|---|---|
| Standard | 1.782 | 1.838 | 1.872 | 1.928 | 1.962 | 2.018 | 2.052 |
| Camarilla | 1.880 | 1.889 | 1.897 | 1.905 | 1.913 | 1.922 | 1.930 |
| Woodie | 1.770 | 1.833 | 1.860 | 1.923 | 1.950 | 2.013 | 2.040 |
| Fibonacci | 1.838 | 1.873 | 1.894 | 1.928 | 1.963 | 1.984 | 2.018 |
| Pivot points | S3 | S2 | S1 | PP | R1 | R2 | R3 |
|---|---|---|---|---|---|---|---|
| Standard | 2.937 | 2.953 | 2.977 | 2.993 | 3.017 | 3.033 | 3.057 |
| Camarilla | 2.989 | 2.993 | 2.996 | 3.000 | 3.004 | 3.007 | 3.011 |
| Woodie | 2.940 | 2.955 | 2.980 | 2.995 | 3.020 | 3.035 | 3.060 |
| Fibonacci | 2.953 | 2.969 | 2.978 | 2.993 | 3.009 | 3.018 | 3.033 |
Numerical data
The following is the status of technical indicators and moving averages registered at the time this technical analysis was created:
| RSI (14): | 33.05 | |
| MACD (12,26,9): | -0.1900 | |
| Directional Movement: | -26.146 | |
| AROON (14): | -28.571 | |
| DEMA (21): | 1.809 | |
| Parabolic SAR (0,02-0,02-0,2): | 2.163 | |
| Elder Ray (13): | 0.001 | |
| Super Trend (3,10): | 2.175 | |
| Zig ZAG (10): | 1.985 | |
| VORTEX (21): | 0.6200 | |
| Stochastique (14,3,5): | 32.20 | |
| TEMA (21): | 1.790 | |
| Williams %R (14): | -33.33 | |
| Chande Momentum Oscillator (20): | 0.000 | |
| Repulse (5,40,3): | -7.2760 | |
| ROCnROLL: | -1 | |
| TRIX (15,9): | -1.3780 | |
| Courbe Coppock: | 12.71 |
| MA7: | 1.920 | |
| MA20: | 1.961 | |
| MA50: | 2.566 | |
| MA100: | 2.755 | |
| MAexp7: | 1.938 | |
| MAexp20: | 2.080 | |
| MAexp50: | 2.404 | |
| MAexp100: | 2.623 | |
| Price / MA7: | +3.39% | |
| Price / MA20: | +1.22% | |
| Price / MA50: | -22.64% | |
| Price / MA100: | -27.95% | |
| Price / MAexp7: | +2.43% | |
| Price / MAexp20: | -4.57% | |
| Price / MAexp50: | -17.43% | |
| Price / MAexp100: | -24.32% |
News
The latest news and videos published on OL GROUPE at the time of the analysis were as follows:
- OL APPEALS AGAINST PROTECTIVE MEASURES TAKEN AGAINST IT
- KARL TOKO EKAMBI TRANSFERRED TO ABHA FC
- Castello Lukeba transferred to RB Leipzig
- ENGLISH INTERNATIONAL AINSLEY MAITLAND-NILES JOINS OL FOR FOUR SEASONS
- RESULTS OF THE TENDER OFFER
About author
Online


Add a comment
Comments
0 comments on the analysis EAGLEFOOTBALLGROUP - Daily