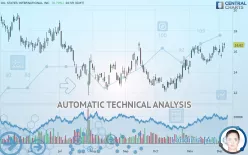
OIL STATES INTERNATIONAL INC. - Daily - Technical analysis published on 12/06/2019 (GMT)
- 305
- 0
- Who voted?
Click here for a new analysis!
- Timeframe : Daily
- - Analysis generated on
- Status : TARGET REACHED

Summary of the analysis

Additional analysis
Quotes
OIL STATES INTERNATIONAL INC. rating 16.62 USD. The price has increased by +0.73% since the last closing with the lowest point at 16.27 USD and the highest point at 16.82 USD. The deviation from the price is +2.15% for the low point and -1.19% for the high point.So that you have an overall view of the price change, here is a table showing the variations over several periods:
Near a new HIGH record (1 month)
Type : Bullish
Timeframe : Weekly
Technical
A technical analysis in Daily of this OIL STATES INTERNATIONAL INC. chart shows a strongly bullish trend. 92.86% of the signals given by moving averages are bullish. The overall trend is supported by the strong bullish signals from short-term moving averages. The Central Indicators scanner detects bullish signals on moving averages that could impact this trend:
Bullish trend reversal : Moving Average 100
Type : Bullish
Timeframe : Daily
Bullish price crossover with Moving Average 20
Type : Bullish
Timeframe : Daily
Bullish price crossover with adaptative moving average 100
Type : Bullish
Timeframe : Daily
An assessment of technical indicators shows a strong bullish signal.
But beware of excesses. The Central Indicators scanner currently detects this:
CCI indicator is overbought : over 100
Type : Neutral
Timeframe : Daily
MACD indicator: bullish divergence
Type : Bullish
Timeframe : Daily
Williams %R indicator is overbought : over -20
Type : Neutral
Timeframe : Daily
Pivot points : price is over resistance 1
Type : Neutral
Timeframe : Weekly
Price is back over the pivot point
Type : Bullish
Timeframe : Daily
Williams %R indicator is back over -50
Type : Bullish
Timeframe : Daily
Central Patterns, the market scanner focusing on chart patterns, resistances and supports found these results:
Near horizontal resistance
Type : Bearish
Timeframe : Daily
Resistance of channel is broken
Type : Bullish
Timeframe : Daily
For a small rebound in the very short term, the Central Candlesticks scanner currently notes the presence of this bullish pattern in Japanese candlesticks:
White morning star
Type : Bullish
Timeframe : Daily
| S3 | S2 | S1 | Price | R1 | R2 | R3 | |
|---|---|---|---|---|---|---|---|
| ProTrendLines | 13.92 | 15.08 | 16.49 | 16.62 | 17.14 | 18.30 | 19.54 |
| Change (%) | -16.25% | -9.27% | -0.78% | - | +3.13% | +10.11% | +17.57% |
| Change | -2.70 | -1.54 | -0.13 | - | +0.52 | +1.68 | +2.92 |
| Level | Major | Intermediate | Major | - | Minor | Intermediate | Minor |
Pivot points can also be used to set your price objectives. Here is the price situation in relation to pivot points:
| Pivot points | S3 | S2 | S1 | PP | R1 | R2 | R3 |
|---|---|---|---|---|---|---|---|
| Standard | 15.08 | 15.49 | 16.00 | 16.41 | 16.92 | 17.33 | 17.84 |
| Camarilla | 16.25 | 16.33 | 16.42 | 16.50 | 16.58 | 16.67 | 16.75 |
| Woodie | 15.12 | 15.52 | 16.04 | 16.44 | 16.96 | 17.36 | 17.88 |
| Fibonacci | 15.49 | 15.85 | 16.06 | 16.41 | 16.77 | 16.98 | 17.33 |
| Pivot points | S3 | S2 | S1 | PP | R1 | R2 | R3 |
|---|---|---|---|---|---|---|---|
| Standard | 14.57 | 15.08 | 15.51 | 16.02 | 16.45 | 16.96 | 17.39 |
| Camarilla | 15.67 | 15.76 | 15.84 | 15.93 | 16.02 | 16.10 | 16.19 |
| Woodie | 14.52 | 15.06 | 15.46 | 16.00 | 16.40 | 16.94 | 17.34 |
| Fibonacci | 15.08 | 15.44 | 15.66 | 16.02 | 16.38 | 16.60 | 16.96 |
| Pivot points | S3 | S2 | S1 | PP | R1 | R2 | R3 |
|---|---|---|---|---|---|---|---|
| Standard | 12.62 | 13.56 | 14.74 | 15.68 | 16.86 | 17.80 | 18.98 |
| Camarilla | 15.35 | 15.54 | 15.74 | 15.93 | 16.12 | 16.32 | 16.51 |
| Woodie | 12.75 | 13.62 | 14.87 | 15.74 | 16.99 | 17.86 | 19.11 |
| Fibonacci | 13.56 | 14.37 | 14.87 | 15.68 | 16.49 | 16.99 | 17.80 |
Numerical data
The following are the details of the technical indicators and moving averages that were collected to generate this technical analysis:
| RSI (14): | 62.51 | |
| MACD (12,26,9): | 0.4300 | |
| Directional Movement: | 14.05 | |
| AROON (14): | 78.57 | |
| DEMA (21): | 16.31 | |
| Parabolic SAR (0,02-0,02-0,2): | 15.29 | |
| Elder Ray (13): | 0.60 | |
| Super Trend (3,10): | 14.51 | |
| Zig ZAG (10): | 16.62 | |
| VORTEX (21): | 0.9400 | |
| Stochastique (14,3,5): | 72.22 | |
| TEMA (21): | 16.37 | |
| Williams %R (14): | -9.95 | |
| Chande Momentum Oscillator (20): | 1.53 | |
| Repulse (5,40,3): | 1.0100 | |
| ROCnROLL: | 1 | |
| TRIX (15,9): | 0.4300 | |
| Courbe Coppock: | 6.86 |
| MA7: | 16.11 | |
| MA20: | 15.82 | |
| MA50: | 14.51 | |
| MA100: | 14.28 | |
| MAexp7: | 16.14 | |
| MAexp20: | 15.73 | |
| MAexp50: | 15.09 | |
| MAexp100: | 15.04 | |
| Price / MA7: | +3.17% | |
| Price / MA20: | +5.06% | |
| Price / MA50: | +14.54% | |
| Price / MA100: | +16.39% | |
| Price / MAexp7: | +2.97% | |
| Price / MAexp20: | +5.66% | |
| Price / MAexp50: | +10.14% | |
| Price / MAexp100: | +10.51% |
News
The latest news and videos published on OIL STATES INTERNATIONAL INC. at the time of the analysis were as follows:
-
 Alaska, More Oil States Battle Budget Deficits
- Oil States International, Inc. to Host Earnings Call
- Oil States International, Inc. to Host Earnings Call
- Oil States to Participate in the Raymond James Investor Conference
-
Oil States
About author

Online


Add a comment
Comments
0 comments on the analysis OIL STATES INTERNATIONAL INC. - Daily