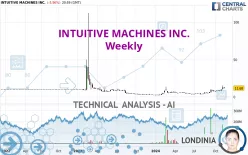
INTUITIVE MACHINES INC. - Weekly - Technical analysis published on 11/19/2024 (GMT)
- 111
- 0
Click here for a new analysis!
- Timeframe : Weekly
- - Analysis generated on
- Status : TARGET REACHED

Summary of the analysis

Additional analysis
Quotes
The INTUITIVE MACHINES INC. rating is 11.68 USD. The price registered an increase of +12.31% over 5 days and has been traded over the last 5 days between 10.07 USD and 12.63 USD. This implies that the 5 day price is +16.04% from its lowest point and -7.52% from its highest point.A bearish opening was detected by the Central Gaps scanner. Sellers are trying to impose a bearish trend in the very short term.
Bearish opening
Type : Bearish
Timeframe : Openning
A study of price movements over other periods shows the following variations:
Abnormal volumes
Timeframe : 5 days
Abnormal volumes
Timeframe : 20 days
Abnormal volumes
Timeframe : 50 days
Technical
A technical analysis in Weekly of this INTUITIVE MACHINES INC. chart shows a strongly bullish trend. The signals given by the moving averages are 82.14% bullish. This strong bullish trend is confirmed by the strong signals currently being given by short-term moving averages. An assessment of moving averages reveals a bullish signal that could impact this trend:
Bullish trend reversal : Moving Average 100
Type : Bullish
Timeframe : Weekly
Technical indicators are strongly bullish, suggesting that the price increase should continue.
Caution: the Central Indicators scanner currently detects an excess:
RSI indicator is overbought : over 70
Type : Neutral
Timeframe : Weekly
CCI indicator is overbought : over 100
Type : Neutral
Timeframe : Weekly
Previous candle closed over Bollinger bands
Type : Neutral
Timeframe : Weekly
CCI indicator: bearish divergence
Type : Bearish
Timeframe : Weekly
RSI indicator: bearish divergence
Type : Bearish
Timeframe : Weekly
The analysis of the price chart with Central Patterns scanners does not return any result.
For a small setback in the very short term, the Central Candlesticks scanner currently notes the presence of this bearish pattern in Japanese candlesticks:
Bearish harami
Type : Bearish
Timeframe : Weekly
Bearish harami cross
Type : Bearish
Timeframe : Weekly
| S2 | S1 | Price | R1 | |
|---|---|---|---|---|
| ProTrendLines | 2.79 | 9.57 | 11.68 | 81.99 |
| Change (%) | -76.11% | -18.07% | - | +601.97% |
| Change | -8.89 | -2.11 | - | +70.31 |
| Level | Minor | Major | - | Intermediate |
Attention could also be paid to pivot points to set price objectives:
| Pivot points | S3 | S2 | S1 | PP | R1 | R2 | R3 |
|---|---|---|---|---|---|---|---|
| Standard | 10.22 | 10.80 | 11.24 | 11.82 | 12.26 | 12.84 | 13.28 |
| Camarilla | 11.40 | 11.49 | 11.59 | 11.68 | 11.77 | 11.87 | 11.96 |
| Woodie | 10.15 | 10.77 | 11.17 | 11.79 | 12.19 | 12.81 | 13.21 |
| Fibonacci | 10.80 | 11.19 | 11.43 | 11.82 | 12.21 | 12.45 | 12.84 |
| Pivot points | S3 | S2 | S1 | PP | R1 | R2 | R3 |
|---|---|---|---|---|---|---|---|
| Standard | 4.41 | 7.01 | 9.71 | 12.31 | 15.01 | 17.61 | 20.31 |
| Camarilla | 10.96 | 11.45 | 11.93 | 12.42 | 12.91 | 13.39 | 13.88 |
| Woodie | 4.47 | 7.04 | 9.77 | 12.34 | 15.07 | 17.64 | 20.37 |
| Fibonacci | 7.01 | 9.03 | 10.28 | 12.31 | 14.33 | 15.58 | 17.61 |
| Pivot points | S3 | S2 | S1 | PP | R1 | R2 | R3 |
|---|---|---|---|---|---|---|---|
| Standard | 4.69 | 5.69 | 6.75 | 7.75 | 8.81 | 9.81 | 10.87 |
| Camarilla | 7.23 | 7.42 | 7.61 | 7.80 | 7.99 | 8.18 | 8.37 |
| Woodie | 4.71 | 5.71 | 6.77 | 7.77 | 8.83 | 9.83 | 10.89 |
| Fibonacci | 5.69 | 6.48 | 6.97 | 7.75 | 8.54 | 9.03 | 9.81 |
Numerical data
The following is the status of the technical indicators and moving averages at the time of publication of this technical analysis:
| RSI (14): | 71.78 | |
| MACD (12,26,9): | 1.5600 | |
| Directional Movement: | 36.34 | |
| AROON (14): | 92.86 | |
| DEMA (21): | 9.47 | |
| Parabolic SAR (0,02-0,02-0,2): | 6.93 | |
| Elder Ray (13): | 3.29 | |
| Super Trend (3,10): | 6.66 | |
| Zig ZAG (10): | 11.68 | |
| VORTEX (21): | 1.2400 | |
| Stochastique (14,3,5): | 81.59 | |
| TEMA (21): | 10.73 | |
| Williams %R (14): | -29.57 | |
| Chande Momentum Oscillator (20): | 6.71 | |
| Repulse (5,40,3): | 15.0000 | |
| ROCnROLL: | 1 | |
| TRIX (15,9): | 2.6700 | |
| Courbe Coppock: | 268.78 |
| MA7: | 11.03 | |
| MA20: | 9.16 | |
| MA50: | 8.14 | |
| MA100: | 6.20 | |
| MAexp7: | 9.86 | |
| MAexp20: | 7.70 | |
| MAexp50: | 6.48 | |
| MAexp100: | 7.03 | |
| Price / MA7: | +5.89% | |
| Price / MA20: | +27.51% | |
| Price / MA50: | +43.49% | |
| Price / MA100: | +88.39% | |
| Price / MAexp7: | +18.46% | |
| Price / MAexp20: | +51.69% | |
| Price / MAexp50: | +80.25% | |
| Price / MAexp100: | +66.15% |
News
The latest news and videos published on INTUITIVE MACHINES INC. at the time of the analysis were as follows:
- Intuitive Machines Reports Third Quarter 2024 Results
- Intuitive Machines Announces Date for Third Quarter 2024 Financial Results Conference Call
- NASA Awards Intuitive Machines Near Space Network Contract with a Maximum Potential Value of $4.82 Billion
- Intuitive Machines Announces Key Leadership Appointments
- Intuitive Machines Strengthens Lunar Service Capabilities with $116.9 million NASA Lunar Contract Award
About author

Online


Add a comment
Comments
0 comments on the analysis INTUITIVE MACHINES INC. - Weekly