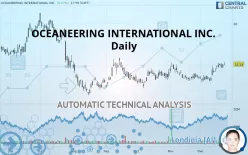
OCEANEERING INTERNATIONAL INC. - Daily - Technical analysis published on 12/26/2019 (GMT)
- 340
- 0
- Who voted?
Click here for a new analysis!
- Timeframe : Daily
- - Analysis generated on
- Status : INVALID

Summary of the analysis

Additional analysis
Quotes
OCEANEERING INTERNATIONAL INC. rating 15.13 USD. The price has increased by +0.27% since the last closing and was between 15.03 USD and 15.41 USD. This implies that the price is at +0.67% from its lowest and at -1.82% from its highest.A bullish gap was detected at the opening by the Central Gaps scanner. There are a lot of buyers and they have the upper hand in the very short term.
Opening Gap UP
Type : Bullish
Timeframe : Openning
So that you have an overall view of the price change, here is a table showing the variations over several periods:
Technical
A technical analysis in Daily of this OCEANEERING INTERNATIONAL INC. chart shows a strongly bullish trend. The signals given by the moving averages are 85.71% bullish. This strong bullish trend is confirmed by the strong signals currently being given by short-term moving averages. The Central Indicators market scanner is currently detecting several bullish signals that could impact this trend:
Bullish trend reversal : Moving Average 100
Type : Bullish
Timeframe : Daily
Moving Average bullish crossovers : MA20 & MA50
Type : Bullish
Timeframe : Daily
An assessment of technical indicators shows a strong bullish signal.
Caution: the Central Indicators scanner currently detects an excess:
CCI indicator is overbought : over 100
Type : Neutral
Timeframe : Daily
Williams %R indicator is overbought : over -20
Type : Neutral
Timeframe : Daily
Price is back over the pivot point
Type : Bullish
Timeframe : Daily
An analysis of the price chart with the Central Patterns scanner (detector of chart patterns and resistances and supports) shows a result that can have an impact on the price change:
Horizontal support is broken
Type : Bearish
Timeframe : Daily
The Central Candlesticks scanner which studies Japanese candlesticks did not detect anything.
| S3 | S2 | S1 | Price | R1 | R2 | R3 | |
|---|---|---|---|---|---|---|---|
| ProTrendLines | 13.17 | 14.07 | 14.88 | 15.13 | 16.29 | 17.87 | 19.61 |
| Change (%) | -12.95% | -7.01% | -1.65% | - | +7.67% | +18.11% | +29.61% |
| Change | -1.96 | -1.06 | -0.25 | - | +1.16 | +2.74 | +4.48 |
| Level | Major | Minor | Major | - | Intermediate | Intermediate | Intermediate |
To determine price objectives, it is also possible to use the pivot points. Here is the price position in relation to pivot points:
| Pivot points | S3 | S2 | S1 | PP | R1 | R2 | R3 |
|---|---|---|---|---|---|---|---|
| Standard | 14.33 | 14.49 | 14.79 | 14.95 | 15.25 | 15.41 | 15.71 |
| Camarilla | 14.96 | 15.01 | 15.05 | 15.09 | 15.13 | 15.17 | 15.22 |
| Woodie | 14.40 | 14.53 | 14.86 | 14.99 | 15.32 | 15.45 | 15.78 |
| Fibonacci | 14.49 | 14.67 | 14.77 | 14.95 | 15.13 | 15.23 | 15.41 |
| Pivot points | S3 | S2 | S1 | PP | R1 | R2 | R3 |
|---|---|---|---|---|---|---|---|
| Standard | 13.24 | 13.74 | 14.25 | 14.75 | 15.26 | 15.76 | 16.27 |
| Camarilla | 14.47 | 14.57 | 14.66 | 14.75 | 14.84 | 14.94 | 15.03 |
| Woodie | 13.24 | 13.74 | 14.25 | 14.75 | 15.26 | 15.76 | 16.27 |
| Fibonacci | 13.74 | 14.13 | 14.37 | 14.75 | 15.14 | 15.38 | 15.76 |
| Pivot points | S3 | S2 | S1 | PP | R1 | R2 | R3 |
|---|---|---|---|---|---|---|---|
| Standard | 10.38 | 11.74 | 12.58 | 13.94 | 14.78 | 16.14 | 16.98 |
| Camarilla | 12.81 | 13.01 | 13.21 | 13.42 | 13.62 | 13.82 | 14.02 |
| Woodie | 10.12 | 11.61 | 12.32 | 13.81 | 14.52 | 16.01 | 16.72 |
| Fibonacci | 11.74 | 12.58 | 13.10 | 13.94 | 14.78 | 15.30 | 16.14 |
Numerical data
The following is the status of the technical indicators and moving averages at the time of publication of this technical analysis:
| RSI (14): | 63.08 | |
| MACD (12,26,9): | 0.3600 | |
| Directional Movement: | 15.00 | |
| AROON (14): | 100.00 | |
| DEMA (21): | 14.69 | |
| Parabolic SAR (0,02-0,02-0,2): | 13.86 | |
| Elder Ray (13): | 0.70 | |
| Super Trend (3,10): | 13.65 | |
| Zig ZAG (10): | 15.13 | |
| VORTEX (21): | 1.0700 | |
| Stochastique (14,3,5): | 86.29 | |
| TEMA (21): | 15.02 | |
| Williams %R (14): | -11.97 | |
| Chande Momentum Oscillator (20): | 1.44 | |
| Repulse (5,40,3): | 0.4000 | |
| ROCnROLL: | 1 | |
| TRIX (15,9): | 0.1900 | |
| Courbe Coppock: | 20.61 |
| MA7: | 14.89 | |
| MA20: | 14.03 | |
| MA50: | 13.95 | |
| MA100: | 13.66 | |
| MAexp7: | 14.82 | |
| MAexp20: | 14.30 | |
| MAexp50: | 14.06 | |
| MAexp100: | 14.31 | |
| Price / MA7: | +1.61% | |
| Price / MA20: | +7.84% | |
| Price / MA50: | +8.46% | |
| Price / MA100: | +10.76% | |
| Price / MAexp7: | +2.09% | |
| Price / MAexp20: | +5.80% | |
| Price / MAexp50: | +7.61% | |
| Price / MAexp100: | +5.73% |
News
The last news published on OCEANEERING INTERNATIONAL INC. at the time of the generation of this analysis was as follows:
- Oceaneering to Participate at the Capital One Securities Energy Conference
- Ceridian HCM Holding, BJ's Wholesale Club Holdings Set to Join S&P MidCap 400; Oceaneering International, Covetrus to Join S&P SmallCap 600
- Oceaneering Reports Third Quarter 2019 Results
- Oceaneering Announces Dates for Third Quarter 2019 Earnings Release and Conference Call
- Oceaneering Awarded Contracts to Supply Subsea Umbilicals for KG-DWN 98/2 Project
About author

Online


Add a comment
Comments
0 comments on the analysis OCEANEERING INTERNATIONAL INC. - Daily