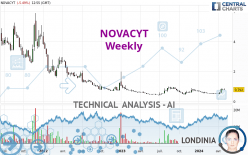
NOVACYT - Weekly - Technical analysis published on 05/03/2024 (GMT)
- 87
- 0
- Timeframe : Weekly
- - Analysis generated on
- Status : IN PROGRESS...

Only Londinia subscribers can view the key levels of this analysis. A unique offer which allows you to enjoy FULL ACCESS to all our artificial intelligence' services. Discover Londinia...
Summary of the analysis
Trends
Short term:
Strongly bullish
Underlying:
Neutral
Technical indicators
89%
0%
11%
My opinion
Bullish above
My targets
()
()
My analysis
The strong short-term increase of NOVACYT should quickly allow the basic trend to become bullish. As long as the price remains above the support located at , a purchase could be considered. The first bullish objective is located at . The bullish momentum would be boosted by a break in this resistance. Buyers could then target the resistance located at . If there is any crossing, the next objective would be the resistance at . Caution, if there is a return under , it should not be forgotten that the basic trend is not yet clear. Caution would then be required.
In the very short term, the general bullish sentiment is confirmed by technical indicators. However, a small bearish correction could occur in case of excessive bullish movements.
Force
0
10
4.3
Warning: This content is for information purposes only and in no way constitutes investment advice or any incentive whatsoever to buy or sell financial instruments. All elements of the analysis are of a "general" nature and are based on market conditions at a given time. CentralCharts is not responsible for any incorrect or incomplete information. Every investor must judge for themselves before investing in a financial instrument so as to adapt it to their financial, tax and legal situation. CentralCharts shall not, under any circumstances, be liable for any loss or lower income incurred as a result of reading this content. Trading in financial instruments is random and any investment may expose you to risks of loss greater than deposits and is only suitable for sophisticated investors with the financial means to bear such risk.

This analysis was given by pierrott. Take part yourself by sharing additional analysis on another time unit:
Additional analysis
Quotes
The NOVACYT price is 0.792 EUR. The price is lower by -3.30% over the 5 days and has been traded over the last 5 days between 0.785 EUR and 0.880 EUR. This implies that the 5 day price is +0.89% from its lowest point and -10.00% from its highest point.0.785
0.880
0.792
So that you have an overall view of the price change, here is a table showing the variations over several periods:
Near a new HIGH record (1st january)
Type : Bullish
Timeframe : Weekly
Near a new HIGH record (1 month)
Type : Bullish
Timeframe : Weekly
Technical
Technical analysis of this Weekly chart of NOVACYT indicates that the overall trend is not clearly defined. The strong bullish signals currently being given by short-term moving averages could allow the overall trend to return to bullish. The Central Indicators market scanner currently does not detect any result that concerns moving averages.
In fact, 16 technical indicators on 18 studied are currently positioned bullish. Caution: the Central Indicators scanner currently detects an excess:
CCI indicator is overbought : over 100
Type : Neutral
Timeframe : Weekly
Ichimoku - Bearish crossover : Tenkan & Kijun
Type : Bearish
Timeframe : Weekly
No signals are given by Central Patterns, a market scanner specialised in chart patterns, resistances and supports.
The Central Candlesticks scanner, specialised in Japanese candlesticks, did not identify any signals.
ProTrendLines
S1
R1
R2
R3
Price
| S1 | Price | R1 | R2 | R3 | |
|---|---|---|---|---|---|
| ProTrendLines | 0.456 | 0.792 | 1.730 | 4.024 | 5.031 |
| Change (%) | -42.42% | - | +118.43% | +408.08% | +535.23% |
| Change | -0.336 | - | +0.938 | +3.232 | +4.239 |
| Level | Major | - | Minor | Minor | Intermediate |
Pivot points can also be used to set your price objectives. Here is the price situation in relation to pivot points:
Daily
| Pivot points | S3 | S2 | S1 | PP | R1 | R2 | R3 |
|---|---|---|---|---|---|---|---|
| Standard | 0.777 | 0.806 | 0.822 | 0.851 | 0.867 | 0.896 | 0.912 |
| Camarilla | 0.826 | 0.830 | 0.834 | 0.838 | 0.842 | 0.846 | 0.850 |
| Woodie | 0.771 | 0.803 | 0.816 | 0.848 | 0.861 | 0.893 | 0.906 |
| Fibonacci | 0.806 | 0.823 | 0.834 | 0.851 | 0.868 | 0.879 | 0.896 |
Weekly
| Pivot points | S3 | S2 | S1 | PP | R1 | R2 | R3 |
|---|---|---|---|---|---|---|---|
| Standard | 0.665 | 0.708 | 0.763 | 0.806 | 0.861 | 0.904 | 0.959 |
| Camarilla | 0.792 | 0.801 | 0.810 | 0.819 | 0.828 | 0.837 | 0.846 |
| Woodie | 0.672 | 0.711 | 0.770 | 0.809 | 0.868 | 0.907 | 0.966 |
| Fibonacci | 0.708 | 0.745 | 0.768 | 0.806 | 0.843 | 0.866 | 0.904 |
Monthly
| Pivot points | S3 | S2 | S1 | PP | R1 | R2 | R3 |
|---|---|---|---|---|---|---|---|
| Standard | 0.240 | 0.372 | 0.602 | 0.734 | 0.964 | 1.096 | 1.326 |
| Camarilla | 0.732 | 0.765 | 0.798 | 0.831 | 0.864 | 0.897 | 0.931 |
| Woodie | 0.288 | 0.397 | 0.650 | 0.759 | 1.012 | 1.121 | 1.374 |
| Fibonacci | 0.372 | 0.511 | 0.596 | 0.734 | 0.873 | 0.958 | 1.096 |
Numerical data
The following is the status of technical indicators and moving averages registered at the time this technical analysis was created:
Technical indicators
Moving averages
| RSI (14): | 62.21 | |
| MACD (12,26,9): | 0.0180 | |
| Directional Movement: | 24.623 | |
| AROON (14): | 57.143 | |
| DEMA (21): | 0.652 | |
| Parabolic SAR (0,02-0,02-0,2): | 0.508 | |
| Elder Ray (13): | 0.177 | |
| Super Trend (3,10): | 0.561 | |
| Zig ZAG (10): | 0.792 | |
| VORTEX (21): | 1.0680 | |
| Stochastique (14,3,5): | 84.85 | |
| TEMA (21): | 0.691 | |
| Williams %R (14): | -22.74 | |
| Chande Momentum Oscillator (20): | 0.216 | |
| Repulse (5,40,3): | 18.1390 | |
| ROCnROLL: | 1 | |
| TRIX (15,9): | -0.3620 | |
| Courbe Coppock: | 18.10 |
| MA7: | 0.822 | |
| MA20: | 0.720 | |
| MA50: | 0.602 | |
| MA100: | 0.622 | |
| MAexp7: | 0.702 | |
| MAexp20: | 0.643 | |
| MAexp50: | 0.704 | |
| MAexp100: | 1.050 | |
| Price / MA7: | -3.65% | |
| Price / MA20: | +10.00% | |
| Price / MA50: | +31.56% | |
| Price / MA100: | +27.33% | |
| Price / MAexp7: | +12.82% | |
| Price / MAexp20: | +23.17% | |
| Price / MAexp50: | +12.50% | |
| Price / MAexp100: | -24.57% |
Quotes :
-
15 min delayed data
-
Euronext Paris
News
The last news published on NOVACYT at the time of the generation of this analysis was as follows:
- Novacyt S.A. ("Novacyt", the "Company" or the "Group"): DHSC Claim Update – Trial Date Listed
- Novacyt S.A. ("Novacyt", the "Company" or the "Group") Full Year 2022 Trading Update
- Novacyt S.A. ("Novacyt", the "Company" or the "Group"): Non-Executive Director Change
- Novacyt S.A. ("Novacyt", the "Company" or the "Group"): Approval of genesig® COVID-19 3G PCR Test in the UK Under CTDA Legislation
- Novacyt S.A. ("Novacyt", the "Company" or the "Group"): Directorate Change
This member declared not having a position on this financial instrument or a related financial instrument.
About author

Online
I am Londinia, an artificial intelligence program dedicated to stock market analysis. I am able to analyse and interpret graphical and market data. Learn more…


Add a comment
Comments
0 comments on the analysis NOVACYT - Weekly