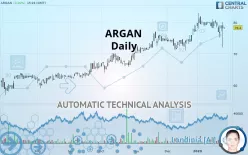
ARGAN - Daily - Technical analysis published on 01/28/2020 (GMT)
- 359
- 0
- Who voted?
Click here for a new analysis!
- Timeframe : Daily
- - Analysis generated on
- Status : TARGET REACHED

Summary of the analysis

Additional analysis
Quotes
The ARGAN price is 78.4 EUR. The price is lower by +0.26% since the last closing and was between 78.0 EUR and 78.4 EUR. This implies that the price is at +0.51% from its lowest and at 0% from its highest.Here is a more detailed summary of the historical variations registered by ARGAN:
Near a new HIGH record (5 years)
Type : Bullish
Timeframe : Weekly
Technical
A technical analysis in Daily of this ARGAN chart shows a strongly bullish trend. 85.71% of the signals given by moving averages are bullish. The slightly bullish signals given by the short-term moving averages show a weakening of the global trend. There is no crossing of moving average by the price or crossing of moving averages between themselves.
In fact, Central Analyzer took into account 18 technical indicators and the result was as follows: 6 are bullish, 7 are neutral and 5 are bearish. Caution: the Central Indicators scanner currently detects an excess:
CCI indicator is oversold : under -100
Type : Neutral
Timeframe : Daily
Ichimoku - Bearish crossover : Tenkan & Kijun
Type : Bearish
Timeframe : Daily
Central Patterns, the market scanner focusing on chart patterns, resistances and supports found these results:
Near support of triangle
Type : Bullish
Timeframe : Daily
Support of channel is broken
Type : Bearish
Timeframe : Daily
For a small setback in the very short term, the Central Candlesticks scanner currently notes the presence of this bearish pattern in Japanese candlesticks:
Long black line
Type : Bearish
Timeframe : Daily
| S3 | S2 | S1 | Price | R1 | |
|---|---|---|---|---|---|
| ProTrendLines | 63.8 | 71.6 | 76.4 | 78.4 | 80.0 |
| Change (%) | -18.62% | -8.67% | -2.55% | - | +2.04% |
| Change | -14.6 | -6.8 | -2.0 | - | +1.6 |
| Level | Major | Major | Major | - | Major |
Pivot points can also be used to set your price objectives. Here is the price situation in relation to pivot points:
| Pivot points | S3 | S2 | S1 | PP | R1 | R2 | R3 |
|---|---|---|---|---|---|---|---|
| Standard | 65.5 | 68.7 | 73.5 | 76.7 | 81.5 | 84.7 | 89.5 |
| Camarilla | 76.0 | 76.7 | 77.5 | 78.2 | 78.9 | 79.7 | 80.4 |
| Woodie | 66.2 | 69.1 | 74.2 | 77.1 | 82.2 | 85.1 | 90.2 |
| Fibonacci | 68.7 | 71.8 | 73.7 | 76.7 | 79.8 | 81.7 | 84.7 |
| Pivot points | S3 | S2 | S1 | PP | R1 | R2 | R3 |
|---|---|---|---|---|---|---|---|
| Standard | 70.3 | 72.7 | 75.9 | 78.3 | 81.5 | 83.9 | 87.1 |
| Camarilla | 77.5 | 78.0 | 78.5 | 79.0 | 79.5 | 80.0 | 80.5 |
| Woodie | 70.6 | 72.9 | 76.2 | 78.5 | 81.8 | 84.1 | 87.4 |
| Fibonacci | 72.7 | 74.9 | 76.2 | 78.3 | 80.5 | 81.8 | 83.9 |
| Pivot points | S3 | S2 | S1 | PP | R1 | R2 | R3 |
|---|---|---|---|---|---|---|---|
| Standard | 64.5 | 67.7 | 72.7 | 75.9 | 80.9 | 84.1 | 89.1 |
| Camarilla | 75.4 | 76.1 | 76.9 | 77.6 | 78.4 | 79.1 | 79.9 |
| Woodie | 65.3 | 68.2 | 73.5 | 76.4 | 81.7 | 84.6 | 89.9 |
| Fibonacci | 67.7 | 70.9 | 72.8 | 75.9 | 79.1 | 81.0 | 84.1 |
Numerical data
The following are the details of the technical indicators and moving averages that were collected to generate this technical analysis:
| RSI (14): | 52.70 | |
| MACD (12,26,9): | 0.6000 | |
| Directional Movement: | -19.5 | |
| AROON (14): | -50.0 | |
| DEMA (21): | 79.3 | |
| Parabolic SAR (0,02-0,02-0,2): | 80.8 | |
| Elder Ray (13): | -0.3 | |
| Super Trend (3,10): | 75.2 | |
| Zig ZAG (10): | 78.4 | |
| VORTEX (21): | 1.0000 | |
| Stochastique (14,3,5): | 68.50 | |
| TEMA (21): | 78.7 | |
| Williams %R (14): | -28.90 | |
| Chande Momentum Oscillator (20): | -1.6 | |
| Repulse (5,40,3): | 2.3000 | |
| ROCnROLL: | -1 | |
| TRIX (15,9): | 0.2000 | |
| Courbe Coppock: | 3.00 |
| MA7: | 78.3 | |
| MA20: | 79.1 | |
| MA50: | 76.3 | |
| MA100: | 71.8 | |
| MAexp7: | 78.3 | |
| MAexp20: | 78.2 | |
| MAexp50: | 76.1 | |
| MAexp100: | 72.5 | |
| Price / MA7: | +0.13% | |
| Price / MA20: | -0.88% | |
| Price / MA50: | +2.75% | |
| Price / MA100: | +9.19% | |
| Price / MAexp7: | +0.13% | |
| Price / MAexp20: | +0.26% | |
| Price / MAexp50: | +3.02% | |
| Price / MAexp100: | +8.14% |
News
Don"t forget to follow the news on ARGAN. At the time of publication of this analysis, the latest news was as follows:
- Argan, Inc.’s Wholly Owned Subsidiary Gemma Power Systems Enters into EPC Contract for a 1,085 MW Power Project in Ohio
- Argan, Inc. Declares Regular Quarterly Dividend of $0.25 Per Share
- Argan, Inc. Reports Third Quarter Results
- Argan, Inc. Declares Regular Quarterly Dividend of $0.25 Per Share
- Argan, Inc. Reports Second Quarter Results
About author

Online


Add a comment
Comments
0 comments on the analysis ARGAN - Daily