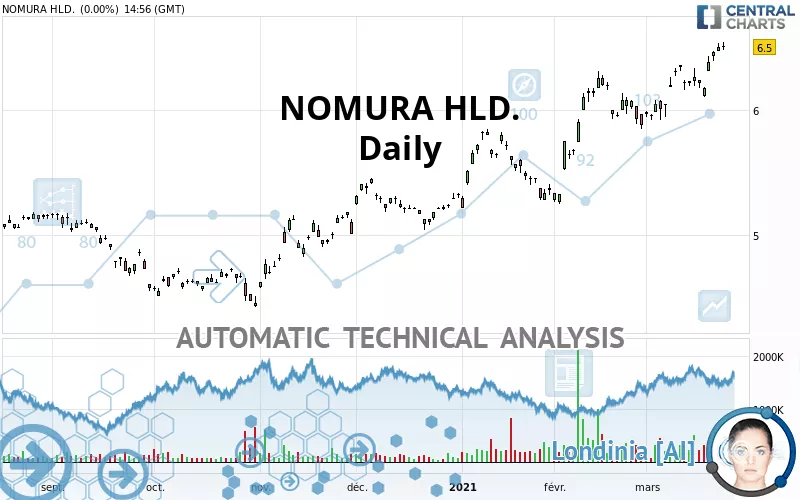
NOMURA HLD. - Daily - Technical analysis published on 03/23/2021 (GMT)
- 270
- 0
Click here for a new analysis!
- Timeframe : Daily
- - Analysis generated on
- Status : INVALID
Summary of the analysis

Additional analysis
Quotes
NOMURA HLD. rating 6.50 USD. The price has increased by +0.00% since the last closing and was traded between 6.48 USD and 6.54 USD over the period. The price is currently at +0.31% from its lowest and -0.61% from its highest.The Central Gaps scanner detects a bullish opening. A small advantage for buyers in the very short term.
Bullish opening
Type : Bullish
Timeframe : Openning
So that you have an overall view of the price change, here is a table showing the variations over several periods:
Near a new HIGH record (5 years)
Type : Bullish
Timeframe : Weekly
New HIGH record (1 year)
Type : Bullish
Timeframe : Weekly
New HIGH record (1st january)
Type : Bullish
Timeframe : Weekly
New HIGH record (1 month)
Type : Bullish
Timeframe : Weekly
The Central Volumes scanner detects abnormal volumes on the asset:
Abnormal volumes
Timeframe : 50 days
Technical
Technical analysis of NOMURA HLD. in Daily shows a strongly overall bullish trend. 92.86% of the signals given by moving averages are bullish. This strongly bullish trend is supported by the strong bullish signals given by short-term moving averages. There is no crossing of moving average by the price or crossing of moving averages between themselves.
In fact, 15 technical indicators on 18 studied are currently bullish. But beware of excesses. The Central Indicators scanner currently detects this:
CCI indicator is overbought : over 100
Type : Neutral
Timeframe : Daily
MACD indicator: bearish divergence
Type : Bearish
Timeframe : Daily
MACD indicator: bullish divergence
Type : Bullish
Timeframe : Daily
RSI indicator: bearish divergence
Type : Bearish
Timeframe : Daily
Williams %R indicator is overbought : over -20
Type : Neutral
Timeframe : Daily
Pivot points : price is over resistance 3
Type : Neutral
Timeframe : Daily
Pivot points : price is over resistance 3
Type : Neutral
Timeframe : Weekly
Pivot points : price is under support 1
Type : Neutral
Timeframe : Weekly
Pivot points : price is under support 3
Type : Neutral
Timeframe : Daily
An analysis of the price chart with the Central Patterns scanner (detector of chart patterns and resistances and supports) shows a result that can have an impact on the price change:
Resistance of channel is broken
Type : Bullish
Timeframe : Daily
No result was found by the Central Candlesticks scanner on Japanese candlesticks.
| S3 | S2 | S1 | Price | R1 | R2 | R3 | |
|---|---|---|---|---|---|---|---|
| ProTrendLines | 5.39 | 5.88 | 6.26 | 6.50 | 6.80 | 15.80 | 18.82 |
| Change (%) | -17.08% | -9.54% | -3.69% | - | +4.62% | +143.08% | +189.54% |
| Change | -1.11 | -0.62 | -0.24 | - | +0.30 | +9.30 | +12.32 |
| Level | Intermediate | Intermediate | Intermediate | - | Major | Minor | Minor |
Attention could also be paid to pivot points to set price objectives:
| Pivot points | S3 | S2 | S1 | PP | R1 | R2 | R3 |
|---|---|---|---|---|---|---|---|
| Standard | 6.41 | 6.44 | 6.47 | 6.50 | 6.53 | 6.56 | 6.59 |
| Camarilla | 6.48 | 6.49 | 6.50 | 6.50 | 6.51 | 6.51 | 6.52 |
| Woodie | 6.41 | 6.44 | 6.47 | 6.50 | 6.53 | 6.56 | 6.59 |
| Fibonacci | 6.44 | 6.46 | 6.48 | 6.50 | 6.52 | 6.54 | 6.56 |
| Pivot points | S3 | S2 | S1 | PP | R1 | R2 | R3 |
|---|---|---|---|---|---|---|---|
| Standard | 5.85 | 5.97 | 6.22 | 6.34 | 6.59 | 6.71 | 6.96 |
| Camarilla | 6.36 | 6.39 | 6.43 | 6.46 | 6.49 | 6.53 | 6.56 |
| Woodie | 5.91 | 6.00 | 6.28 | 6.37 | 6.65 | 6.74 | 7.02 |
| Fibonacci | 5.97 | 6.12 | 6.20 | 6.34 | 6.49 | 6.57 | 6.71 |
| Pivot points | S3 | S2 | S1 | PP | R1 | R2 | R3 |
|---|---|---|---|---|---|---|---|
| Standard | 4.26 | 4.75 | 5.32 | 5.81 | 6.38 | 6.87 | 7.44 |
| Camarilla | 5.59 | 5.69 | 5.78 | 5.88 | 5.98 | 6.07 | 6.17 |
| Woodie | 4.29 | 4.77 | 5.35 | 5.83 | 6.41 | 6.89 | 7.47 |
| Fibonacci | 4.75 | 5.16 | 5.41 | 5.81 | 6.22 | 6.47 | 6.87 |
Numerical data
The following is the status of the technical indicators and moving averages at the time of publication of this technical analysis:
| RSI (14): | 68.24 | |
| MACD (12,26,9): | 0.1500 | |
| Directional Movement: | 24.20 | |
| AROON (14): | 92.86 | |
| DEMA (21): | 6.42 | |
| Parabolic SAR (0,02-0,02-0,2): | 6.15 | |
| Elder Ray (13): | 0.22 | |
| Super Trend (3,10): | 6.17 | |
| Zig ZAG (10): | 6.50 | |
| VORTEX (21): | 0.9900 | |
| Stochastique (14,3,5): | 96.14 | |
| TEMA (21): | 6.45 | |
| Williams %R (14): | -4.84 | |
| Chande Momentum Oscillator (20): | 0.46 | |
| Repulse (5,40,3): | 1.0600 | |
| ROCnROLL: | 1 | |
| TRIX (15,9): | 0.3100 | |
| Courbe Coppock: | 12.06 |
| MA7: | 6.36 | |
| MA20: | 6.19 | |
| MA50: | 5.92 | |
| MA100: | 5.52 | |
| MAexp7: | 6.39 | |
| MAexp20: | 6.23 | |
| MAexp50: | 5.96 | |
| MAexp100: | 5.64 | |
| Price / MA7: | +2.20% | |
| Price / MA20: | +5.01% | |
| Price / MA50: | +9.80% | |
| Price / MA100: | +17.75% | |
| Price / MAexp7: | +1.72% | |
| Price / MAexp20: | +4.33% | |
| Price / MAexp50: | +9.06% | |
| Price / MAexp100: | +15.25% |
News
Don"t forget to follow the news on NOMURA HLD.. At the time of publication of this analysis, the latest news was as follows:
About author

Online


Add a comment
Comments
0 comments on the analysis NOMURA HLD. - Daily